
A phase noise analyzer (PNA) performs a direct measure of phase noise in a signal and provides the lowest noise floor of any test instrument [1]. However, it is not commonly found in labs. Spectrum analyzers [2] are much more common, and typically include a software option to convert spectral power (in dBm) into spectral energy density (in dBc/Hz) appropriate for phase noise. Since both instruments report phase noise data, it's tempting to think their results should match, at least within the limit of the instruments' respective noise floors and offset frequency range. However, a PNA and a spectrum analyzer measure very different noise processes, and so their data is not always comparable. Conversely, a spectrum analyzer and a real-time oscilloscope observe the same noise processes. However, jitter reported by a spectrum analyzer is fundamentally different than jitter reported by an oscilloscope. This article examines the key noise processes involved in measurements of jitter and phase noise, shows how these processes impact test results for various types of test equipment, and provides insight for interpreting these results.
Noise processes in jitter measurements
Consider a voltage signal containing three independent noise processes represented by the following equation,

where
 is baseband amplitude noise (i.e. voltage noise),
 is modulated amplitude noise (i.e. AM noise),
 represents a clock (or data) function, which, for the purposes of illustration, we assume here is a sine or square wave,
 is phase error,
 is a carrier (clock fundamental) frequency, and
 is time.
Phase error,, in the time domain may be viewed as phase noise in the frequency domain. Phase error is a source of TIE jitter as illustrated in Fig. 1 using a Gaussian distribution (for simplicity) with a standard deviation of  . Since the instantaneous phase error is independent of the signal's amplitude and slew rate, the distributions of phase error and TIE jitter have the same standard deviation
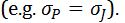
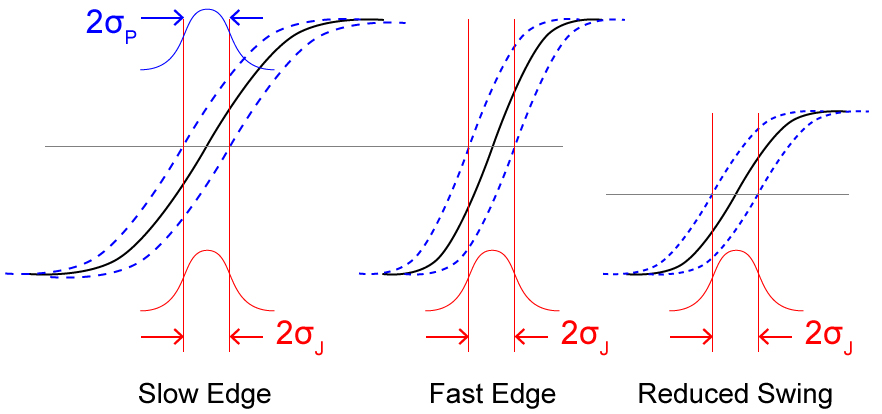
Fig. 1 Phase error converts to TIE jitter independent of edge rate and signal swing.
Baseband amplitude noise,, is voltage noise (referred to 0 Hz) that adds to a signal of interest. Baseband amplitude noise is a source of TIE jitter as illustrated in Fig. 2 using a Gaussian distribution (for simplicity) with a standard deviation of  . The noise modifies the signal's mid-point crossing location, which creates jitter. Increasing the edge rate (i.e. reducing the transition time) minimizes this conversion of baseband amplitude noise to jitter. Baseband amplitude noise does not affect phase error (or phase noise).
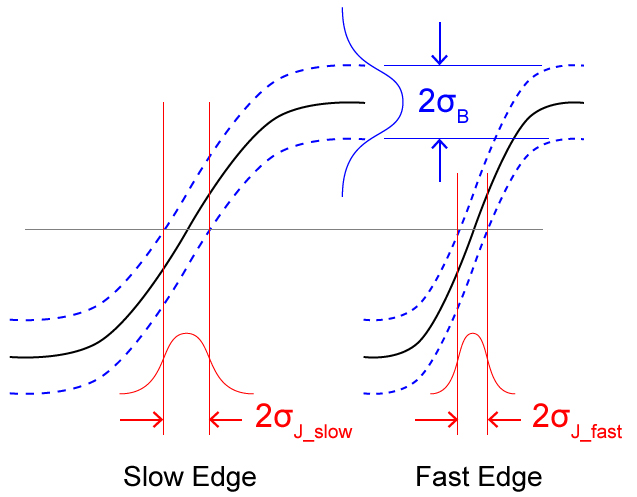
Fig. 2 Baseband amplitude noise converts to TIE jitter as a function of slew rate.
Modulated amplitude noise, , or AM noise, is voltage noise modulated onto a carrier signal [3]. It is important to note that AM noise is not a source of TIE jitter, as illustrated in Fig. 3. The carrier in Fig. 3 is a sine wave (dotted black waveform) with a period equal to one relative time unit. The modulated amplitude noise (dashed blue waveform) is also a sine wave, but with a period ten times higher (10 relative time units). The resulting AM modulated waveform (red waveform) is bounded in amplitude by the modulation waveform.
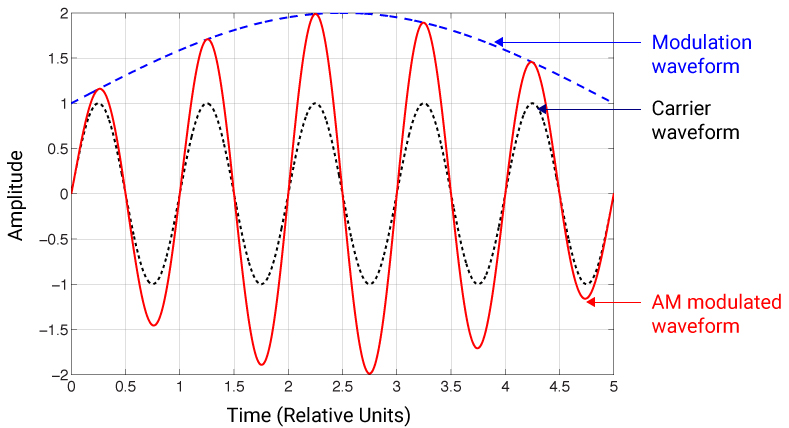
Fig. 3 AM noise on a signal does not influence zero-crossing locations, and therefore is not alone a source of TIE jitter. AM noise is illustrated with a DC bias of 0 (top) and 1 (bottom).
The top and bottom graphs in Fig. 3 illustrate a modulation waveform, , with a DC bias of 0 and 1, respectively. In both cases, the resulting AM modulated waveform (in red) crosses its midpoint (0 amplitude) at exactly the same time as the original (unmodulated) carrier waveform. Therefore, AM noise alone is not a source of TIE jitter.
However, since AM noise changes the slew rate, AM noise can influence TIE jitter when baseband amplitude noise is present. Since AM noise creates a variety of different slew rates in the resulting AM modulated waveform (see Fig. 3), any baseband amplitude noise,, present in the system will convert to TIE jitter proportionally. AM noise therefore acts as a gain knob for converting baseband amplitude noise into TIE jitter. Depending on the amount of baseband amplitude and AM noise present, AM noise can increase (Fig. 3 top) or decrease (Fig. 3 bottom) TIE jitter compared to the unmodulated carrier waveform.
Note that the amount of modulation shown in Fig. 3 is extremely high to serve as a visual aid to support the above conclusions. In practice, the amount of AM noise present is much smaller. Also, Fig. 3 illustrates single-tone AM noise (i.e. using only one sine wave frequency), but in practice many random AM noise frequencies are present.
Verification of noise processes in jitter measurements
To verify the above conclusions, a waveform generator is used to add the above three noise processes to a signal, one by one, which is then measured for TIE jitter using a real-time oscilloscope as shown in Fig. 4.

Fig. 4 A waveform generator is used to create various noise processes for jitter measurement using an oscilloscope.
First, phase error is added to a 10 MHz square wave carrier. The phase error is created using 1 MHz (sine wave) phase modulation with 90 degree deviation. Figure 5 shows the signal waveform with PM (left), and its corresponding TIE jitter spectrum (right). The peak-peak jitter deviation at 1 MHz is five orders of magnitude above its noise floor. Phase error (and phase noise) is therefore observed to greatly influence jitter.
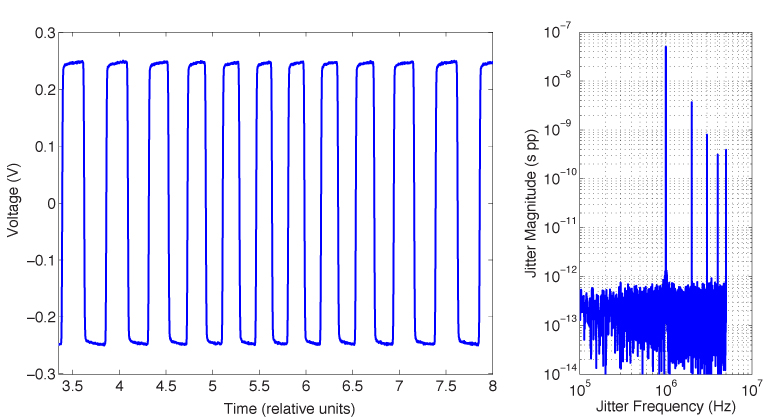
Fig. 5 Signal waveform with PM (left) and corresponding TIE jitter spectrum (right), showing PM greatly influences jitter.
Next, baseband amplitude noise is separately added to a 10 MHz square wave carrier. The baseband amplitude noise is created by summing the square-wave signal with a 1 MHz sine wave whose peak-peak amplitude is 25% of the square-wave's amplitude. Figure 6 shows the signal waveform with baseband amplitude noise (left), and its corresponding TIE jitter spectrum (right). The peak-peak jitter deviation at 1 MHz is three orders of magnitude above its noise floor. Baseband amplitude noise is therefore also observed to greatly influence jitter.
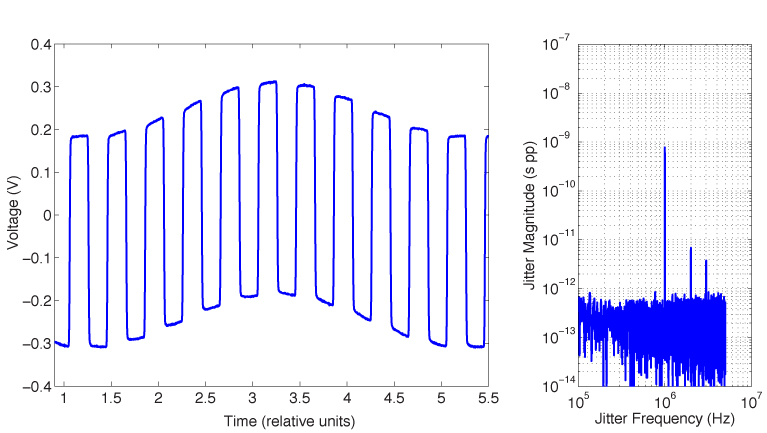
Fig. 6 Signal waveform with baseband amplitude noise (left) and corresponding TIE jitter spectrum (right), showing baseband amplitude noise greatly influences jitter.
Finally, AM noise is separately modulated onto a 10 MHz square-wave signal. The AM noise is created using a 1 MHz sine wave with 30% percent depth. Figure 7 shows the signal waveform with AM noise (left), and its corresponding TIE jitter spectrum (right). The peak-peak jitter deviation at 1 MHz is less than an order of magnitude above its noise floor.
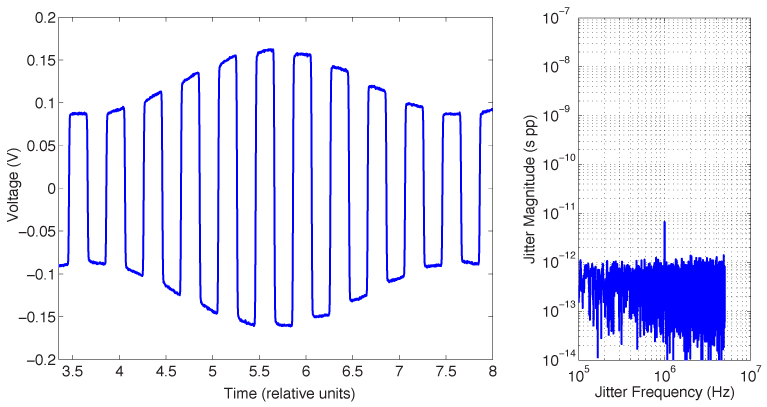
Fig. 7 Signal waveform with AM (left) and corresponding TIE jitter spectrum (right), showing AM has little influence on jitter.
In reality, the 1 MHz spur shown in Fig. 7 is due to a small amount of baseband amplitude noise either present in the signal or added to the signal by the oscilloscope (e.g. due to input amplifier noise, and/or ADC quantization noise). The height of the 1 MHz spur is proportional to this baseband amplitude noise. If no baseband amplitude noise is present, the spur will disappear. Modulated amplitude noise (e.g. AM noise) alone is therefore observed to not influence jitter.
Noise processes in phase noise measurements
PNAs can independently measure phase noise and AM noise in a signal. Example PNAs include E5052B from Keysight Technologies, and FSWP from Rohde and Schwarz. Their specialized architecture enables phase noise to be measured near the thermal noise floor and as close as 1 Hz (or lower) in offset frequency. For precision clocks, phase noise typically dominates at near-in offset frequencies. At higher offset frequencies, AM noise can dominate. Figure 8 illustrates an example 100 MHz clock signal's phase (dotted curve) and AM (dashed curve) noise derived from a PNA. The measured phase and AM noise data extend to a 30 MHz offset.
In practice, phase noise data is commonly integrated [4] over some offset region of interest to compute a phase jitter value (in seconds RMS) for analyzing applications. This phase jitter is often compared with TIE jitter from an oscilloscope. However, as per the above discussion of noise processes, phase jitter and TIE jitter can be very different quantities. If valid comparisons are to be made, the test process must be well thought out to account for differences between measurements.
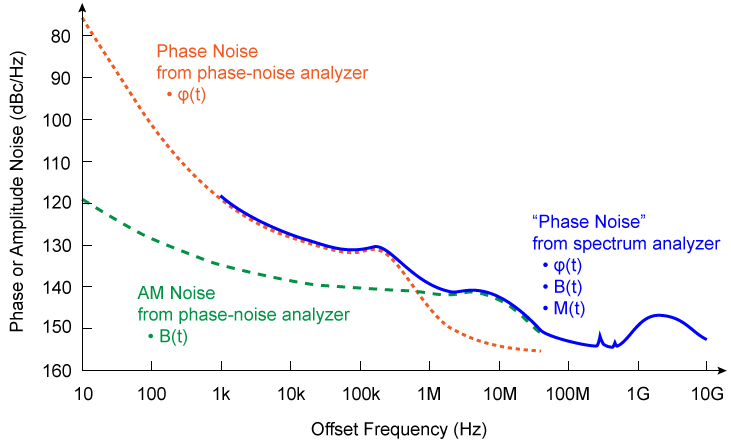
Fig. 8 Example single-sideband phase and amplitude noise in a signal, highlighting differences between PNA and spectrum analyzer data.
Although a PNA an excellent choice for analyzing phase noise, it is a specialized instrument, not present in many labs. Spectrum analyzers are much more common, and usually include a software option for converting measured spectral power into phase noise. Additionally, some applications, such as data converters, require phase noise data at higher offset frequencies than a PNA can provide. In these situations, a spectrum analyzer may be sought to analyze phase noise in a signal (assuming the noise floor of the analyzer is sufficiently low).
When analyzing phase noise with a spectrum analyzer, it's important to understand that a spectrum analyzer cannot distinguish between (nor separate) the three noise processes discussed above. The spectrum analyzer measures spectral power of all three noise processes plus the carrier signal simultaneously, and plots the result as a single curve. An example "phase noise" curve derived from a spectrum analyzer is also show in Fig. 8. The term "phase noise" is enclosed in quotes here to remind us that a spectrum analyzer, when computing phase noise data, assumes phase noise is the dominant noise process among the three. However, this assumption may not always be true, particularly at higher offset frequencies. As a result, deriving a value of phase jitter from spectrum analyzer "phase noise" data becomes less accurate as the dominant noise process in the signal shifts from phase noise to either of the other two noise processes.
For example, suppose that AM noise, is the dominant noise process in a spectrum analyzer's "phase noise" curve. From the above analysis, AM noise alone is not a source of jitter, so phase jitter derived from this "phase noise" gives a pessimistic result. That is, the computed phase jitter overestimates the true phase jitter in the signal. As such, if the value of phase jitter meets the end application's requirements, then all is well. Otherwise, a more detailed analysis is needed.
Conversely, suppose baseband amplitude noise, , is the dominant noise process in a spectrum analyzer measurement of "phase noise." Compared to phase jitter derived from a PNA, the spectrum analyzer's phase jitter will again be pessimistic. However, compared to TIE jitter derived from an oscilloscope, all other factors being equal, the spectrum analyzer's phase jitter number could be optimistic or pessimistic, depending on the slew rate and amount of baseband amplitude noise present in the signal.
You might think, since an oscilloscope and a spectrum analyzer both observe the same (three) noise processes, that a value of phase jitter derived from a spectrum analyzer should agree better with an oscilloscope's TIE jitter number than a phase jitter number derived from a PNA. This, however, is not necessarily true, because the math to compute phase jitter from amplitude noise measured with a spectrum analyzer does not account for the slew rate of the signal (which a TIE jitter measurement correctly captures). Recall that phase noise refers to the spectral energy density of phase fluctuations, whereas amplitude noise (baseband or AM) refers to the spectral energy density of voltage fluctuations. Therefore, while the integral of phase noise (in dBc/Hz) produces a number in units of seconds RMS, the integral of amplitude noise (in dBc/Hz) produces a number in units of volts RMS. This voltage must then be converted to jitter by dividing by the slew rate (in Volts/second) of the signal. None of this is accounted for when phase jitter is derived from a spectrum analyzer's "phase noise" plot dominated by amplitude noise. Here, phase jitter and TIE jitter values are simply not comparable without making assumptions.
To troubleshoot the presence of various noise processes, one can try passing the signal through a low-noise buffer to sharpen its edges. This process reduces baseband amplitude noise in the signal, without modifying phase noise in the signal as it passes through the buffer (the buffer, however, may add a small amount of phase noise to the signal). Measure the "phase noise" curve with a spectrum analyzer before and after buffering the signal. If the two curves are identical, then phase noise in the original signal truly dominates, and the phase jitter value computed for the original signal is accurate (at least within the noise floor limitation of the instrument). Alternatively, if the buffered phase noise curve is higher than the original curve, then the buffer added noise to the signal and the experiment is not particularly useful. Lastly, if the buffered phase noise curve is lower than the original curve, then this region of divergence is dominated by amplitude noise (either baseband or AM).
Note that some test equipment (such as Rohde and Schwarz, FSWP[5]) contain both PNA and spectrum analyzer hardware in a single box. While this greatly simplifies measurements requiring both instruments, a potential source of confusion can occur when measuring phase noise to an offset frequency above the limit of the PNA measurement (typically 30% of the carrier frequency). In this case, the test equipment measures phase noise  up to the offset-frequency limit of the PNA, then automatically switches to the spectrum analyzer to measure "phase noise"
  up to the maximum offset frequency specified for the test. The equipment then combines the PNA and spectrum analyzer data to create one "phase noise" plot, although the boundary between PNA and spectrum analyzer data is not identified on the plot. For example, characterizing phase noise in a 100 MHz clock across an offset frequency range of 1 Hz to 1 GHz results in PNA measuring phase noise up to a 30 MHz offset frequency, and a spectrum analyzer measuring "phase noise" at higher offset frequencies. Interpreting the resulting single plot (which combines both PNA and spectrum analyzer data) can be confusing considering the various noise processes involved, and how they are observed during the measurement. Finally, this interpretation must also be squared with how the end application observes these noise processes.
Conclusions
This article discussed three independent noise processes present in a signal, comprising (1) phase error, or phase noise, (2) baseband amplitude noise, and (3) modulated amplitude noise, or AM noise. TIE jitter measurements using a real-time oscilloscope are greatly influenced by the first two noise processes. AM noise, however, is not a source of TIE jitter, although it can influence TIE jitter when baseband amplitude (i.e. voltage) noise is present.
Although a PNA can separately measure phase noise and AM noise, a spectrum analyzer cannot distinguish between noise processes. As such, spectrum analyzers reporting "phase noise" data include an inherent (undocumented) assumption that phase noise is the dominate noise process among these three processes. When this is not true, interpretation of the phase noise data, including any derived phase jitter values, becomes complicated. In such cases, a buffer can be used to troubleshoot the presence of these different noise processes.
Furthermore, some test equipment include both PNA and spectrum analyzer hardware in a single box. Depending how a test is defined, using such equipment can produce a "phase noise" plot where a lower offset-frequency region is measured with a PNA (capturing one noise process) with higher offset frequencies measured with a spectrum analyzer (capturing all three noise processes). Such equipment can be very useful in characterizing devices, although interpreting the results requires a deeper understanding of the measurement, as discussed herein.
References
[1] "Phase Noise Measurement Solutions," Keysight Technologies document 5990-5729EN (2018), http://literature.cdn.keysight.com/litweb/pdf/5990-5729EN.pdf.
[2] "Spectrum Analysis Basics," Keysight Technologies document 5952-0292 (2016), https://literature.cdn.keysight.com/litweb/pdf/5952-0292.pdf.
[3] https://en.wikipedia.org/wiki/Amplitude_modulation
[4] G. Giust, "GUIDE-1: User guide for desktop phase noise calculator," v1.6 (Dec. 6, 2016), JitterLabs website, https://www.jitterlabs.com/support/documentation/guide1.
[5] R&S FSWP Phase Noise Analyzer Specifications, data sheet version 06.00 (Nov. 2017), https://www.rohde-schwarz.com.