
Circuit Foil Luxembourg is a high added value copper foil manufacturer. With the advent of 5G technologies and high-speed communications, higher frequencies are being used, which raises new challenges on the physics plan. One of the main objective of the company is to develop copper foils intended to this market.
Because of these high frequencies, losses in copper are increased due to skin effect. Indeed, the skin depth is a key parameter which rules the insertion loss. To have an order of magnitude, the skin depth for copper is approximatively equal to 375 nm at 30 GHz.
The roughness of copper foils has a detrimental effect on signal losses in PCBs. Therefore, reducing roughness is crucial in minimizing signal losses. Nevertheless, roughness is essential to ensure a good adherence between the prepreg and the copper foil. Therefore, a compromise must be found between adherence and power integrity. We must find a way to reduce insertion loss while keeping good adherence. This paper presents a novel approach to evaluate signal losses without assuming any specific roughness shape.
First, the rough surface topography is measured using AFM on different copper foils. The AFM results are then incorporated into a numerical model that assesses the signal losses due to surface roughness by resolving Maxwell’s equations.
Previous studies by Morgan and Hammerstadt aimed to calculate signal losses from rough surfaces. They computed K, a dimensionless coefficient which describe the additional loss due to roughness as a function of frequency.
 (1)
(1)
Where P are the Joule loss and P0 is the Joule loss for a perfectly smooth surface.
Later, by resolving Maxwell’s equation analytically in a spherical nodule, Hall and Huray developed their famous “snowball” model. However, their models are too restrictive for industrial PCB applications. Unlike our model, they assume a specific form of roughness that is rarely consistent with reality.
The first step of our approach involves measuring the topography of copper foils using AFM technology. This method provides a precise description of the surface and allows for the derivation of various roughness parameters. The topography measured for different samples is shown Figure 1.
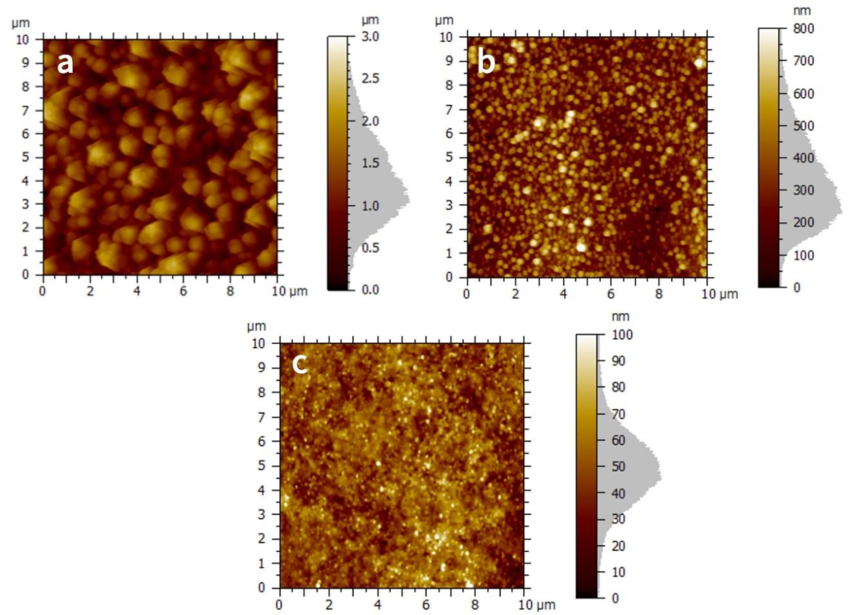 Figure 1. Surface topography measured by AFM for BF-TZA (a), BF-NN(b), BFL-NF (c).
 Next, these surfaces are incorporated into our numerical model on the top surface of a cube, where an initial magnetic field H0 is applied. The (xyz) data from the AFM measurements are imported in a 10 µm x 10 µm square. By this way, simulations are performed directly on real surface's measured topographies. The model is illustrated in Figure 2.
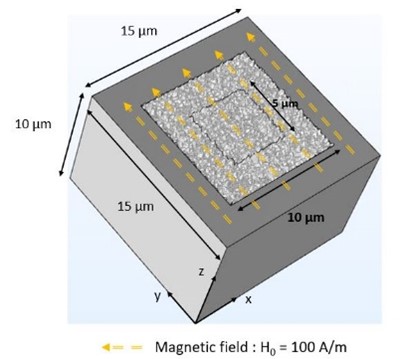 Figure 2. Model geometry.
A simulation is launched for each sample for a frequency from 1 GHz to 70 GHz. The magnetic fields at 1 GHz, 15 GHz, and 55 GHz are shown in Figure 3.
The simulation results confirm our expectations, and the magnetic fields are consistent; for each foil, the higher the frequency, the thinner the skin depth. The important point here is the shape of this magnetic field depending on the roughness.
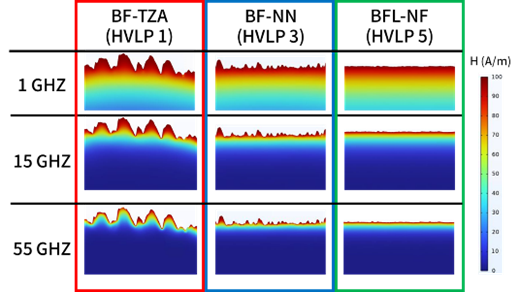 Figure 3. Cross sections of the magnetic field across three samples at 1 GHz, 15 GHz, and 55 GHz.
Furthermore, by integrating the magnetic field we have observed into Figure 4, it is clear that the higher the frequency and the rougher the surface, the higher the loss. This is consistent with the way in which roughness interacts with the magnetic field. Our developed tool enables the evaluation of signal losses for any rough surface.
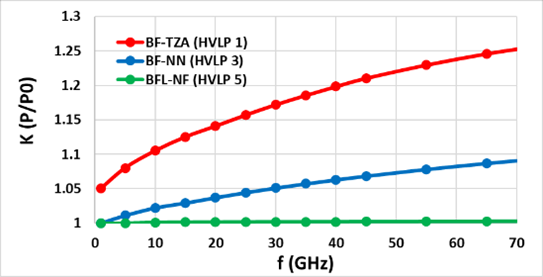 Figure 4. K vs. frequency for BF-TZA, BF-NN, and BFL-NF.
Our model allows for the calculation of signal loss induced by rough surfaces. This model will save significant time for the PCB industry, enabling accurate assessment of signal losses in new product developments. The magnetic field is directly computed based on AFM measurements of the samples. Our numerical results have been validated using both theoretical and experimental results. Therefore, this tool can be used to develop a better understanding of the influence of roughness on copper loss.
The paper referenced here received the Best Paper Award at DesignCon 2023. To read the entire DesignCon 2023 paper, download the PDF.