
Signal integrity engineers almost always have to work with S-parameters. If you have not had to work with them yet, then chances are you will sometime in your career. As speed moves up in the double-digit GB/s regime, many industry standards are moving to serial link-based architectures and are using frequency domain compliance limits based on S-parameter measurements.
A vector network analyzer (VNA) is the test instrument of choice to measure S-parameters from a device under test (DUT). By definition, each S-parameter (Sij) is the ratio of the sine wave voltage coming out of a port to the sine wave voltage that was going into a port (Equation 1). Each S-parameter is complex with a magnitude and a phase.
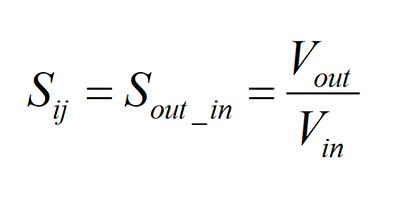
Suffice it to say, for mathematical reasons, the indexes refer to the port in which the voltages are coming or going. This is counter intuitive to our normal train of thought and is important to recognize this relationship when working with S-parameters.
Single-ended S-parameters
Figure 1 shows an example of a 1-port, 2-port, and 4-port DUTs and their respective S-parameter matrices representing uniform transmission lines with respective port index labeling. Each S-parameter in the matrix is a single-ended measurement from one port to another.
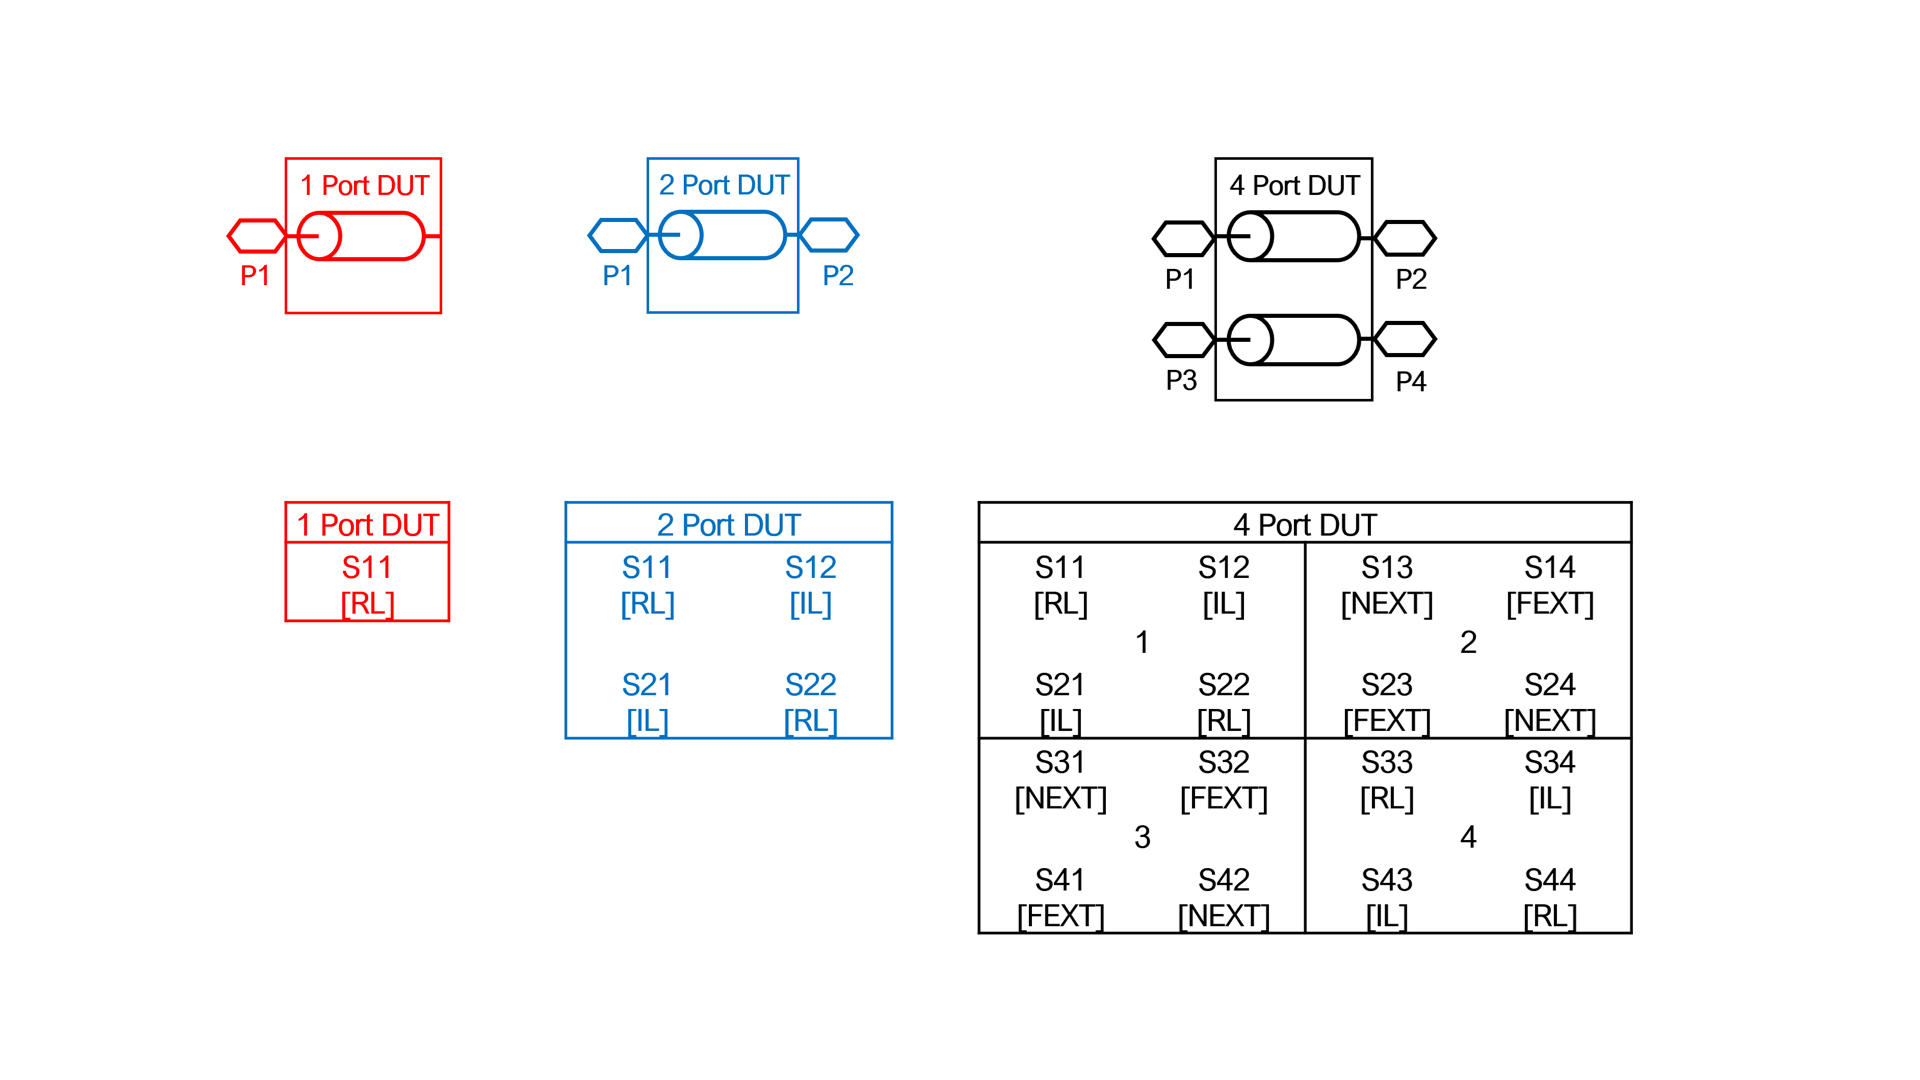
Fig. 1 From left to right examples of 1-port (Red), 2-port (Blue), 4-port (Black) DUTs and their respective S-parameter matrices.
A 1-port DUT has one S-parameter (S11) shown in red in Figure 1. It is the ratio of the voltage coming out of Port 1 to the voltage going into Port 1. As a measure of reflected energy out of Port 1, it is also known as return loss (RL).
A 2-port DUT has four S-parameters shown in blue in Figure 1. S-parameters with the same index subscript numbers, i.e. S11, S22 are RL. S-parameters with alternate index subscript numbers, are a measure of transmitted energy and is the ratio of the voltage coming out of a port to the voltage going into the opposite port. It is also known as insertion loss (IL). For example, S12 is the ratio of the voltage coming out of Port 1 to the voltage going into Port 2, whereas S21 is the ratio of the voltage coming out of Port 2 to the voltage going into Port 1.
A 4-port DUT has 16 S-parameters, divided into four quadrants shown in black in Figure 1. As you can see, the number of S-parameter combinations is the square of the number of ports. In this example, the top left quadrant 1 and bottom right quadrant 4 are the same as individual 2-port DUTs with different port indices.
S-parameters in the top right quadrant 2 and bottom left quadrant 3 in Figure 1 describe the near-end and far-end coupling of the respective ports. When unwanted coupling happens at the near-end, it is referred to as near-end cross talk (NEXT). When it happens at the far-end, it is known as far-end crosstalk (FEXT).
They are described in Figure 2. Although there is no industry standard for labeling a DUT with four or more ports, a practical way is to use the port order shown so that the 2-port DUT is a subset of the top left quadrant of the 4-port DUT. When you do this, the port order labeling is consistent as you increase the number of ports, with odd ports on the left and even ports on the right. S12 and S21 always describe the IL terms, while S13 and S31 define the NEXT terms.
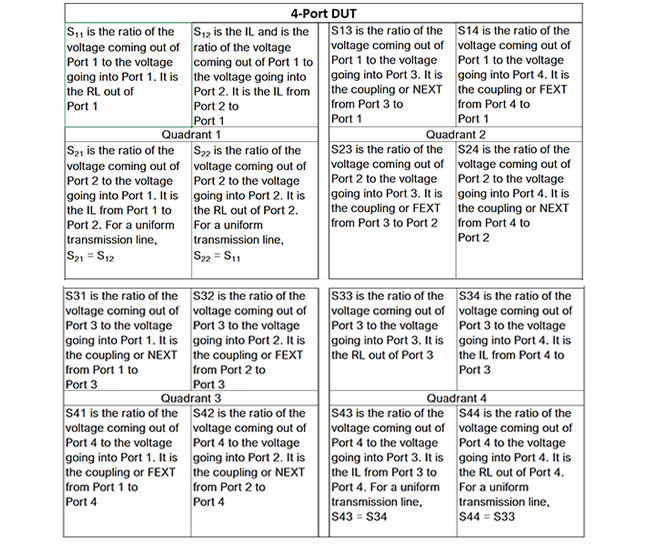
Fig. 2 4-port DUT quadrant descriptions.
But sometimes 3rd party 4-port S-parameters are labeled with ports 1 and 2 on the left side, while ports 3 and 4 are on the right side. In this configuration, S31 and S42 are now the IL terms. This is counter intuitive when moving from 2-port to 4 or more port DUT and leading to potential confusion when cascading S-parameters to build a channel model, or converting to mixed-mode S-parameters. Whenever you get S-parameter files from 3rd party, it is always prudent to test it and compare IL plots against port order to ensure you are using them correctly.
Typically, 4-port S-parameters are saved in Touchstone format with a .snp extension, where n is the number of ports. Many electronic design automation (EDA) and circuit simulation software tools allows you to view and plot S-parameters from Touchstone files.
Figure 3 is a schematic of a 4-port S-parameter component used in Keysight ADS. When the component is linked to an appropriate .s4p Touchstone file and the ports are connected as shown, the 16-port S-parameter matrix can be plotted and analyzed.
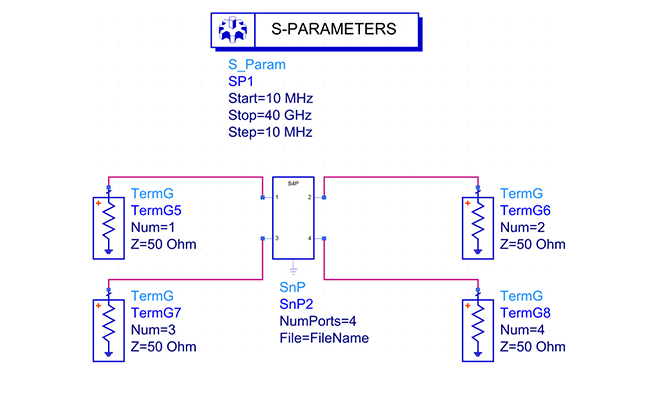
Fig. 3 Keysight ADS schematic used to plot 4-port single-ended S-parameters.
The 1-port and 2-port S-parameters are included in the same plot as the 4-port S-parameters plotted in Figure 4. The top left (red) and bottom right (green) quadrants plot the RL and IL, while the top right (blue) and bottom left (magenta) quadrants plot the NEXT and FEXT.
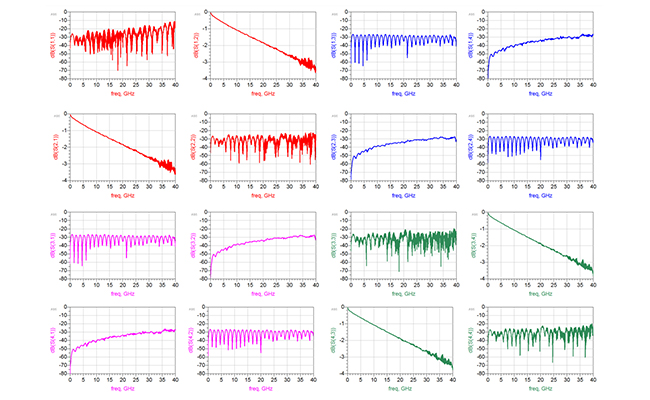
Fig. 4 An example of 4-port S-parameter single-ended plots of a uniform transmission line.
Mixed-mode S-parameters
Signal integrity engineers often have to check channel models and S-parameter measurements against industry standard compliance plots. Many of those plots are in terms of mixed-mode S-parameters, which means the single-ended measurements need to be converted to a mixed-mode matrix.
Two single-ended transmission lines with coupling are also known as a differential pair, as shown in Figure 5. When we talk about single-ended transmission lines with coupling, we are usually interested in their single-ended properties like characteristic impedance (Zo), phase delay, and NEXT/FEXT relationships as described above.
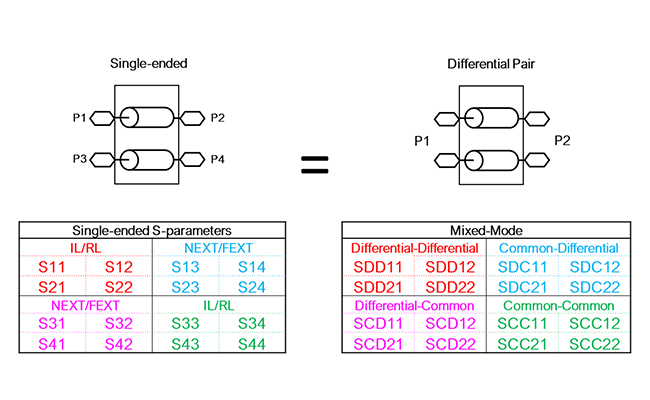
Fig. 5 Single-ended vs. mixed-mode S-parameter matrices of two coupled transmission lines.
But when we talk about a differential pair, we are interested in the mixed-mode S-parameters like differential and common signals and how they interact within the pair. Because we are describing the exact same interconnect, they are equivalent.
When describing a differential pair, there are only four possible outcomes in response to an input signal as defined by the mixed-mode S-parameter matrix:
- A differential signal enters the differential pair and a differential signal comes out
- A differential signal enters the differential pair and a common signal comes out
- A common signal enters the differential pair and a differential signal comes out
- A common signal enters the differential pair and a common signal comes out
Mixed-mode S-parameters in each quadrant are described in Figure 6:

Fig. 6 Mixed-Mode quadrant descriptions.
Single-ended S-parameters, with port order shown in Figure 5, can be mathematically converted into mixed-mode S-parameters using equations shown in Table 1. Alternatively, Keysight ADS can simplify this process using equations on 4-port single-ended or using 4-port Balun components, as shown in Figure 7.
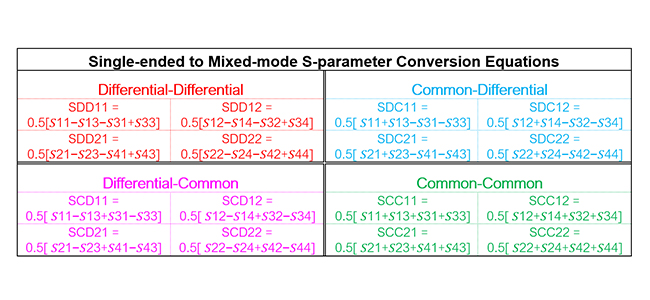
Table 1. Single-ENDED to Mixed-Mode S-Parameter Conversion Equations
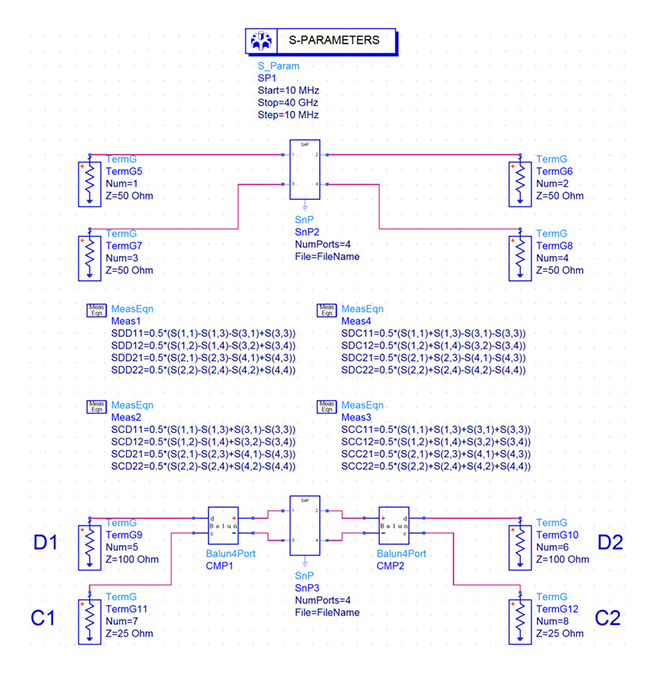
Fig. 7 Keysight ADS schematic used to convert from 4-port single-ended to 2-port mixed-mode S-parameters using equations or 4-port Balun components. Differential and common port numbering as D1, D2, C1, C2 respectively.
Figure 8 plots mixed-mode S-parameters from equations in Table 1. Each quadrant is color-coded to coincide with the respective table quadrants.
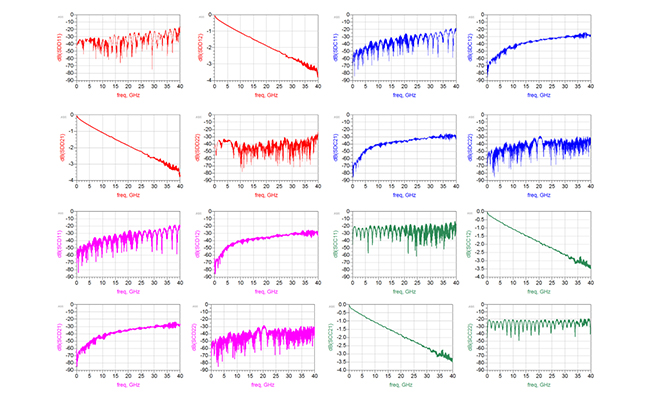
Fig. 8 An example of 4-port S-parameter mixed-mode plots of a differential transmission line.
In closing, if you get in the habit of labeling your S-parameter files as described above, then converting from single-ended to mixed-mode will be simplified and you will have less chances of misinterpreting your results.
References
1. M. Resso and E. Bogatin, “Signal Integrity Characterization Techniques,” International Engineering Consortium, 300 West Adams Street, Suite 1210, Chicago, Illinois 60606-5114, USA, ISBN: 978-1-931695-93-0 https://www.amazon.com/Signal-Integrity-Characterization-Techniques-Bogatin-ebook/dp/B07P9277WY/ref=sr_1_fkmr0_1?keywords=bogaitn+resso&qid=1581289220&sr=8-1-fkmr0
2. A. Huynh, M. Karlsson, and S. Gong (2010).
Mixed-Mode S-Parameters and Conversion Techniques, Advanced Microwave Circuits and Systems, Vitaliy Zhurbenko (Ed.), ISBN: 978-953-307-087-2,InTech, Available from: www.intechopen.com/books/advanced-microwave-circuits-and-systems/mixed-mode-s-parameters-and-conversion-techniques.
3. A. P. Neves, M. Resso, and C.T. Wang Lee, “S-parameters: Signal Integrity Analysis in the Blink of an Eye”, Signal Integrity Journal, https://www.signalintegrityjournal.com/articles/432-s-parameters-signal-integrity-analysis-in-the-blink-of-an-eye.
4. Keysight Advanced Design System (ADS) [computer software], (Version 2020). URL: www.keysight.com/en/pc-1297113/advanced-design-system-ads?cc=US&lc=eng.
Published in the SIJ July 2020 Print Issue, Technical Feature: Page 18.