
Shortly after I retired I met (online) Dr. Johannes Adam of ADAM Research, Leimen, Germany. Dr. Adam had created a software simulation program called Thermal Risk Management (TRM) [1]. TRM can be used for thermally characterizing an entire board, complete with energized components, and it is used extensively in the automotive industry in Europe.
I had been interested in the thermal properties of individual traces. Most of us are aware of the old IPC trace current/temperature charts that can be traced (no pun intended!) to the mid 1950s. Those charts were finally replaced by the charts in IPC 2152, “Standard for Determining Current Carrying Capacity in Printed Board Design,” August, 2009. IPC 2152 was the result of the most thorough, most complete, most careful study of trace current/temperature effects that had ever been undertaken. This publication verified what we had all expected, the original studies of external traces tracing back to the mid 1950s were poorly conceived and controlled. What we had not all expected was that the initial studies of internal traces back then were just flat wrong!
Johannes and I soon realized our interests were very complementary and we started out on a collaboration that continues to today. Our collaboration resulted in numerous articles and a book, covering much more than this paper will cover today [2].
As things developed, we first looked at individual, isolated traces, just like those in IPC 2152. Our first efforts were to see if we could get essentially the same results as IPC 2152 using TRM models and simulations. If so, that would seem to validate using TRM simulations for other analyses. The next effort was to see what PCB board parameters had the most impact in determining trace temperatures. This would essentially be a sensitivity analysis of the results to material variations. After that, we would look at board PCB design considerations, and look at those design sensitivities. The final step would be looking at individual mounted component variations and see what effect they had on the trace current/temperature relationships.
TRM and Current/Temperature Relationships: The first part of the analysis was straightforward. We were able to get very tight correlations between the published IPC 2152 results and our TRM simulations, particularly for external traces. We developed a formula for external traces:

This formula appeared to fit all external traces, regardless of trace width or thickness, over wide current and temperature ranges. Subsequent analyses, as well as later comparisons to actual boards under test, continued to confirm the validity of TRM for simulation and modeling purposes.
Sensitivities to Material Parameters: Traces generate heat because of I2R power dissipation in the trace. They cool because of thermal conductivity into the board material, convection, and radiation. A stable temperature is reached when the rates of heating and cooling are equal.
Furthermore, heating and cooling are “point” concepts. By that, we mean that the rate of heating and the rate of cooling can be different at each individual point along a trace (and on the board.) Therefore, it is less relevant to talk about the resistance of a trace (for example) over its length than it is to talk about its resistivity at a specific point along the trace. So, when we talk about heating and cooling, it is appropriate to talk about it “per unit length.”
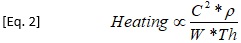
The variable, I, of course is current (also denoted as C). R is resistance (in this case, per unit length), which can be further broken into its components of resistivity (ρ) and trace geometry, or W * Th. Thus, trace heating is proportional to:
Board materials have a parameter called “thermal conductivity coefficient,” (Tcon) whose units are W/m/K (Watts per meter per degree K). These relate to the ability of the board material to conduct heat away from the trace. There are two thermal conductivity coefficients, one in the “in plane” (x,y plane, or horizontal) direction (Tcon_x), and one in the “through plane” (z-axis, or vertical) direction (Tcon_z). These are typically different (though related) and the through plane coefficient is typically the smaller of the two. Typical values for Tcon are in the range of 0.3 to about 0.9, but recently materials suppliers have begun adding ceramic filler to the board material which can significantly increase the thermal conductivity coefficient. One problem for board simulation purposes is that the thermal conductivity coefficient(s) are often not published by the material supplier (although there appears to be some improvement in this area.) If the coefficients are not published (or are incorrect), investigations and modeling become much more difficult.
Thermal convection and radiation are often captured in a parameter called the “Heat Transfer Coefficient,” or HTC, (whose units are W/m2K). Physicists have a pretty good grasp of HTC related to radiation. They also have a pretty good grasp of HTC for a heated plate. Their expertise suffers a little when we talk about a narrow heated strip (e.g. a trace.) So it turns out we need to be a little creative in estimating HTC.
We conclude that:

Equations 2 and 3 capture the variables that impact the trace current/temperature relationship. We will look at them individually.
Current (C): Let’s take this as our one given.
Thickness (Th). We usually assume that a trace has reasonably constant thickness over its length. How wrong that assumption can be! During PCB board fabrication, there is often a copper plating step performed on at least the top layer (and maybe others.) Copper plating is often not well controlled in that step. Thickness variations of as much as 50% can be found across some boards. Figure 1 shows a 40 mil portion of a 1.0 inch microsection along (not across) a trace on a test board. A thickness variation over just this portion of the trace of over 13% (0.31 mils) is evident.

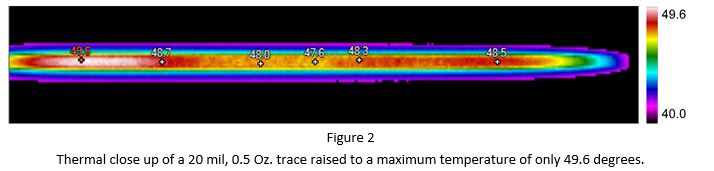
Figure 2 illustrates a thermal image of part of a 20 mil, 0.5 Oz. trace heated to a ΔT of approximately 30 oC. A thermal variation of at least 2 oC can be seen over this length. Virtually all actual traces we investigated displayed significant thermal variations along the trace’s length. It turns out one of the largest contributors to trace temperature variations and uncertainties is thickness variation along the trace. We can show with Equation 1 that a change of thickness of just 0.03 mils can result in a 4% change in temperature for a typical trace.
Trace Width: While trace thickness can be quite variable, the width of a trace is usually well known and fairly stable. If we look at the current/temperature relationships of typical traces, we see relationships like those shown in Figure 3. The curves show the relationships for three 1.0 Oz. external traces of 5 mil, 50 mil, and 200 mil width. Of particular note is how steep the relationship is for the 5 mil trace compared to the others.
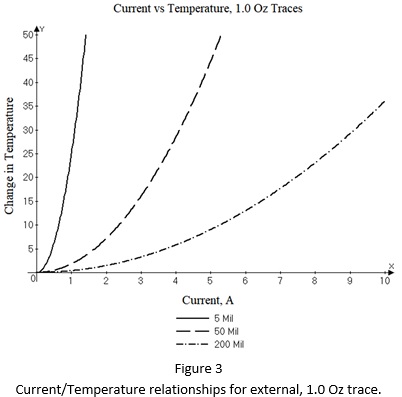
This means that ΔT is much more sensitive to a tolerance on width for narrow traces than it is on wider traces. For example, a 0.1 mil change in width can make a big difference in a narrow trace while it is hardly noticeable on a wider trace.
Thermal Conductivity (Tcon): The thermal conductivity of board dielectrics is often unknown. It is often unpublished, and if it is published it is often given as a single value. Therefore, you don’t know if the published figure relates to Tcon_x or Tcon_z. Our studies suggest there is a very strong relationship between Tcon and the ratio of glass to resin; that is, Tcon is determined by the presence, type, and percentage of glass. It follows, then, that there should be a relationship between Tcon and Er (relative dielectric constant), although this hypothesis remains untested. Recently, board dielectrics are appearing containing ceramic particles, which increase the thermal conductivity of the material.
A typical range of Tcon for normally available FR4 materials is from about 0.4 to 0.7. Our modeling suggests that this degree of uncertainty can cause a variation in ΔT of over 15%.
HTC, Heat Transfer Coefficient: The heat transfer coefficient is hard to deal with. First, it is largely unknown (although we estimated it to be, under laboratory conditions about 10.5.) And, under laboratory conditions, the convection and radiation components appear to be about equal (Note 3). One empirical problem is that HTC varies with temperature. HTC is impacted by such things as:
Resistivity: There are two types of copper typically found on (and in) PCBs, rolled and deposited (plated). Plated copper is almost pure copper, with a resistivity of 1.68 * 10-8 Ohm-m. Rolled copper typically comes from a copper alloy that has some embedded impurities. Its resistivity can be in the range of 1.72 * 10-8 Ohm-m. The presence of impurities always increases the resistivity. This difference (on the order of 2%) has a direct effect on the trace temperature. But our testing found very little evidence that tolerances and variations of resistivity across a board had a significant impact on trace temperature variations and measurements.
Summary: The two biggest (and quite possibly unknown) material property variations that impact trace current/temperature relationships appear to be variations in trace thickness and variations (or uncertainties) in the thermal conductivity coefficients. The impacts of HTC appear to still be unknown; much more research is needed in this area.
Sensitivities to Board Design Decisions: Many of the board design decisions have a significant impact on the temperature of an otherwise isolated trace.
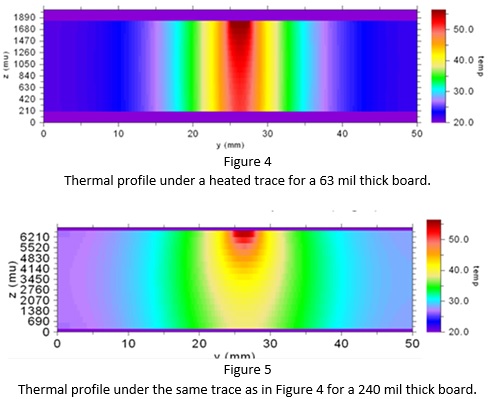
Board thickness: Arguably, the board thickness is either a board parameter or it is a design decision. Regardless, the board thickness does impact the current/temperature relationships of a trace. Trace temperature goes down as board thickness increases. Refer to Figures 4 and 5. Figure 4 illustrates the thermal profile in the vertical axis underneath a heated trace (carrying 7 Amps.) The board (and the distance between the board material/air interface) is 63 mils thick. Figure 5 illustrates the same trace on a 240 mil thick board. The thicker board has more material under it for conducting the heat away from the trace, so the temperature is lower. In this illustration, the temperature drops from about 57 oC on the 63 mil thick board to about 48 oC on the 240 mil thick board. The improvement with thickness has diminishing returns; in this illustration there will not be much more reduction of temperature if the board is any thicker.
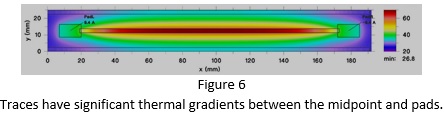
Thermal Gradients: It is easy to assume that since copper has such high thermal conductivity, a trace’s temperature is uniform everywhere. We have already seen (Figure 2) this is not true. Figure 6 illustrates a 6” long, 100 mil wide trace heated to about 69 oC. This is the temperature at the midpoint. There is a thermal gradient from the midpoint to the pads, which, in this illustration, results in a much lower temperature at the pads. The primary reason for the gradient is the difference in the size of the pad compared to the size of the trace.
Trace Length: Given that there is a thermal gradient caused by the influence of the pad, it follows that there will be a difference in trace temperature as a function of trace length. For example, if we take the same trace shown in Figure 6 and reduce its length from 6” to 2” and 1”, the temperature will drop from 69 oC to 61 oC and 49 oC, respectively. The impact depends directly on the relationship between the pad size and the trace size.
Adjacent traces: If we route a second trace adjacent to our primary race, the temperature of the primary trace decreases. This is because the copper area of the adjacent trace improves the conductivity of the heat away from the primary trace. The impact is not as much as you might expect, however. For example, simulations suggest if we route a second trace 8 mils away from our heated trace, above, the temperature of the heated trace will drop from about 69 oC to about 64 oC. BUT, the temperature of the adjacent trace rises to about 55 oC. This is because the board material increases in temperature as the heat is conducted away from the primary trace.
Underlying Planes: Finally, if we add a plane underneath a current carrying trace, the temperature of the trace will drop significantly. Simulations suggest, for example, if we add a plane under our 69 oC trace above, either an external plane on the far side of the board or an internal one at 10 mils under the trace, the trace temperature will drop to 54 oC or 45 oC, respectively. AND, the thermal profile in the board material will change dramatically as the plane conducts heat much more broadly across the board.
Sensitivities to Active Components: When we start thinking about adding circuit components to the board, and especially to energizing those components, the problem becomes so complex that generalities and no longer possible. We can only analyze the thermal profiles of such assemblies with sophisticated software simulation programs such as TRM.
Summary: The ability to analyze and predict the current/temperature effects of isolated traces (e.g. IPC 2152) is a good start. But the actual temperature of a trace may be somewhat different (either higher or lower) because of uncertainties in (or a lack of reporting of) the actual trace thickness or board material thermal conductivity coefficient. Then, virtually anything we do during the actual real world board design tends to lower the temperature of the trace, sometimes dramatically. The biggest impacts tend to come from the influence of pads, varying trace lengths, and the presence or absence of planes. Finally, when we start talking about adding components, the situation becomes so complicated that no generalities are possible.
Notes:
1. TRM (Thermal Risk Management) was created by Dr. Johannes Adam, President of Adam Research (www.adam-research.com). TRM was originally conceived and designed to analyze temperatures across a circuit board, taking into consideration the complete trace layout with optional Joule heating as well as various components and their own contributions to heat generation. Learn more about TRM at http://www.adam-research.com.
2. Brooks, Douglas G. and Adam, Johannes, “PCB Trace and Via Currents and Temperatures: The Complete Analysis. 2nd Ed.,” 2017, available at Amazon.com. Most of the results reported in this article come from Chapters 5, 6, and 12.
3. In a vacuum, the convection component drops to 0 and HTC becomes about 5 to 6.