

Figure 11. Plug and play board kit example
Option 3, use of demonstration boards, provides a way to verify the results of de-embedding across multiple samples of the same structure on the same board. This is useful to quantify the differences in measured results due to manufacturing process variations. Figure 12 shows the layout of a typical demonstration board, where multiple DUTs and multiple fixtures (similar to the simulation library) are built on the same board. This includes the variation from manufacturing of the same 2x thru reference, the fixture attached to the DUT, and the DUT itself. In addition, the sensitivity of the de-embed process to variations in fixture features, such as impedance, launch, loss and delay can be explored in this test board.
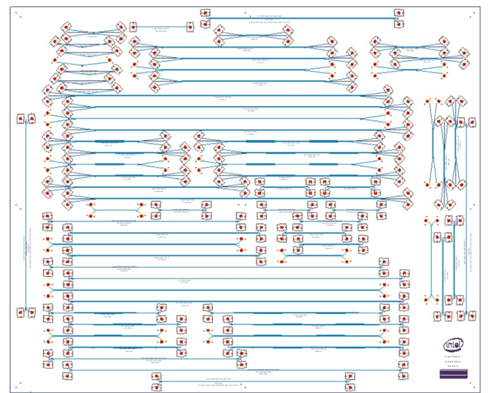
Figure 12. A demonstration board with multiple DUT and fixture structures
S-parameter Integrity and Validation
Accurate simulation depends on accurate models or data for the components in the system being simulated. If the extracted or de-embedded DUT data are inaccurate or of poor quality, the results of the simulation will be inaccurate. This is of greater impact as the frequencies of interest increase. There are many potential sources of problems in dealing with S-parameter data, some of which may not be immediately obvious. Some of these sources include:
- Differences in naming of ports, especially with differential DUTs
- Differences in frequency range or step size
- Mismatches in normalizing impedance
- Poor S-parameter quality, including non-causal, non-passive, and non-reciprocal data
The draft P370 standard deals with each of these. A preferred method is suggested for naming of ports, with odd-numbered ports on the input side of the DUT or network, and the even-numbered ports on the right or output side, as shown in Figure 13a. Thus with the simple case of a single-ended two port DUT, port 1 is the input and port 2 is the output, and s21 describes the “through” behavior of the DUT or network. This is consistent with conventional usage. In the case of a four port DUT or network, the differential input port 1 consists of single-ended ports 1 and 3, while the differential output port 2 consists of single-ended ports 2 and 4, as shown in Figure 13b.
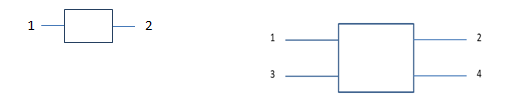
Figure 13. Preferred port numbering for single ended (a) and differential two port (b) DUTs or networks
Misinterpretation of S-parameter data is a common cause of errors. In order to address many of the causes of misinterpretation of data, a number of new keywords have been proposed for inclusion in the Touchstone file header, and will be requested to be incorporated in the Touchstone file standard that is maintained by the IBIS Open Forum. These include:
- Data source – measured, calculated, or simulated
- Component type – de-embedding structure, calibration structure, DUT, composite (fixture-DUT-fixture or fixture-DUT), or fixture
- Calibration method – SOLT or TRL
- De-embedding method – 1X Reflect, 2x Thru, Impedance-corrected 2x thru, or General S-parameter file
Differences in frequency ranges of the models or S-parameters used in a simulation can generally be dealt with by the simulator, but the maximum frequency for the simulation will be that of the lowest maximum frequency of the models and/or data being used. Differences in step sizes also can be handled through interpolation, but there may be some inaccuracy introduced in the results, especially if the step sizes are large.
S-parameter quality
S-parameters can exhibit a number of behaviors that can cause problems with simulation, everything from inaccurate results to “crashing” the simulation tool. These undesirable behaviors often fall into one of three categories: non-causality, non-passivity, and non-reciprocity. Real, physical systems do not produce energy at their outputs prior to the application of an input. On the other hand, non-causal systems can produce outputs prior to the occurrence of the input. If the de-embedded S-parameter is non-causal, this will produce erroneous simulation results.
Similarly, real physical systems without internal energy sources do not produce any output if no input is applied. However, non-passive systems do not satisfy this requirement.
Real, passive physical systems are generally reciprocal, meaning that if the inputs and outputs of a DUT are reversed, the same output would be produced by the application of a given input as was obtained prior to reversing the input and output. With a non-reciprocal DUT, the output of the DUT with normal connections could be different than that obtained prior to reversal of the input and output.
Given that these undesirable behaviors often result from inaccurate de-embedding, the P370 committee has developed a set of metrics with which to gauge the quality of S-parameters. It is often difficult to gauge the quality of S-parameter data, given the large volume of data and the limited ability of the user to examine all the potential interactions. The only quality checks performed may be examining the magnitude of s21 and s11. This approach is incomplete in that it ignores some of the common problems that result from measurement and de-embedding errors which can result in non-passive, non-causal, or non-reciprocal behavior. The quality checking tools developed as part of the P370 standard effort give the user the ability to evaluate the S-parameter data and make decisions relative to the quality and usability of those data. These tools provide quantitative measures of three aspects of data quality, and are intended as an example implementation, but their use is not required for conformance to the standard.
The draft standard specifies metrics with specific ranges of numeric values that designate the quality level of a given S-parameter, on a scale of zero to 100. The respective metrics are the passivity quality metric (PQM), the causality quality metric (CQM), and the reciprocity quality metric (RQM), with limits as defined in the draft standard. S21 and s11 for the two sample S-parameters are plotted in Figure 14. One was de-embedded with the traditional 2x method, while the second used the impedance corrected method. Obvious differences between the two can be observed in the plots. The CQM value for the S-parameter in Figure 14a is 81 mV, while the value for the S-parameter of Figure 14b is 7 mV, indicating significant non-causal behavior for the first case.

Figure 14. S21 and s11 plots for two S-parameters.
Application Based Quality Checking
One new approach proposed in P370 is the application based quality checking. The goal is to estimate the quality of the given S-parameters in terms of passivity, causality and reciprocity in physical units. The process is as follows:
- First, , S-Parameters models will be created based on the original S- Parameters, for passivity, causality and reciprocity comparison
- Then the similarity metric will be defined in the time domain to get estimation in physical units
- Finally, the similarity metric in the time domain will be applied between the original and created models to get correspondingly passivity, causality, and reciprocity estimations in physical units.
Comparison of S-parameters
In evaluating the accuracy of S-parameter data, it is often useful to compare two different S-parameters. These could represent two sets of DUT data, extracted and de-embedded measured data, or de-embedded data obtained by using two different methods. This has traditionally been qualitative, for instance comparing the shapes of two overlaid plots of s11 or s21 data. This approach is imprecise, and does not provide any quantitative measure of agreement between the two parameters. The P370 committee has also developed a software tool for comparing two S-parameters which provides a quantitative measure of the similarity of two S-parameters. Comparison metrics have been defined which allow classifying the degree of agreement, using the error vector magnitude (EVM):
- the magnitude of the absolute error vector calculated at each frequency
- the magnitude of the relative error vector calculated at each frequency
- the magnitude of the composite error vector which is 0.9 x the magnitude of the absolute error 10 vector + 0.1 x the magnitude of the relative error vector
- the cumulative or integrated relative energy error up to each frequency value.
The error vector calculation is illustrated in Figure 15.
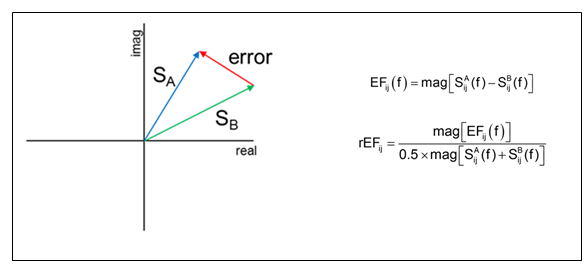
Figure 15. Error Vector Magnitude calculation
The degree of agreement is used to classify the results into three quality Levels, with the limit criteria for each level listed in the standard. The bandwidth of the S-parameter’s level is the highest frequency at which the similarity metric meets the specified limit. Comparison may also be done of time domain (e. g., TDR) data. A sample frequency domain comparison is shown in Figure 16.

Figure 16. S-parameter comparison example
Tutorials
The draft P370 standard includes tutorial material on topics such as network parameters of multiport networks, calibration and de-embedding, and printed circuit board design and fabrication.
Best Practices
The P370 standard includes a description of best practices that provide guidance to the designer, to help avoid some of the common problems that one may encounter at these frequencies. These include fixture design, coaxial launch connector footprints, via designs, frequency extrapolation to DC, and generation of Gaussian pulses for use in simulation.
Conclusions
The IEEE P370 standard provides guidance on fixture designs, best practices, a data library for use in verifying de-embedding tools, and sample tools for evaluating and comparing S-parameter data. Designing fixtures and measuring devices for use up to 50 GHz is non-trivial, and it is hoped that this standard will provide users with the means to obtain accurate, usable results for use in their designs.
Acknowledgements
The authors would like to thank the members of the IEEE P370 committee, for their contributions to the standard and this paper.
References
- DeGroot, D., Jargon, J., and Marks, R.: “Multiline TRL Revealed,” ARFTG Microwave Measurement Conference, December, 2002.
- Barnes, H., Schaefer, R., and Moreira, J.: “Analysis of Test Coupon Structures for the Extraction of High Frequency PCB Material Properties,” 2013 17th IEEE Workshop on Signal and Power Integrity (SPI), May 12, 2013.
- Frei, J., Cai, X.-D., and Muller, S.: “Multiport S-Parameter and T-Parameter Conversion with 7 Symmetry Extension,” IEEE Trans. Microwave Theory and Techniques, vol. 56 no. 11, November, 2008, 8 pp. 2493-2504.
- Barnes, H., Bogatin, E., Moreira, J., Ellison, J., Nadolny, J., Huang, C.-C., Tsiklauri, M., Moon, S.-J/. and Herrmann, V.: "A NIST Traceable PCB KIT for Evaluating the Accuracy of De-Embedding Algorithms and Corresponding Metrics", DesignCon 2018.
Outstanding Paper Award Winner from EDI CON USA 2018.