
Measuring the noise on a power rail seems to be a straightforward task. However, there are some basic pitfalls that can cause incorrect, or even downright strange, results. Let's look at one of these challenges: RF pickup. We'll demonstrate the effect of RF pickup on a power-rail measurement, and then we'll show you an effective means of mitigating that effect.
But before we get into the issue itself, let's take a step back for a moment. It's always important to understand the capabilities (and limitations) of your oscilloscope, because armed with that knowledge, you can better anticipate what your measurements will yield.
If we're talking about measuring noise, and especially in the context of a low-level signal, something we really want to know is our oscilloscope's noise floor. How much noise is the front-end amplifier inherently producing?
For this example we are using the Teledyne LeCroy HDO8108A oscilloscope (Figure 1) with a bandwidth of 1 GHz, eight analog input channels, and 12-bit vertical resolution. We can observe the instrument's internal amplifier noise by grounding an input channel (Figure 2). Because of the scope’s vertical resolution, we can get a pretty accurate measurement.

Figure 1: Teledyne LeCroy's HDO8108A sports a very lownoise floor of about 145 μV
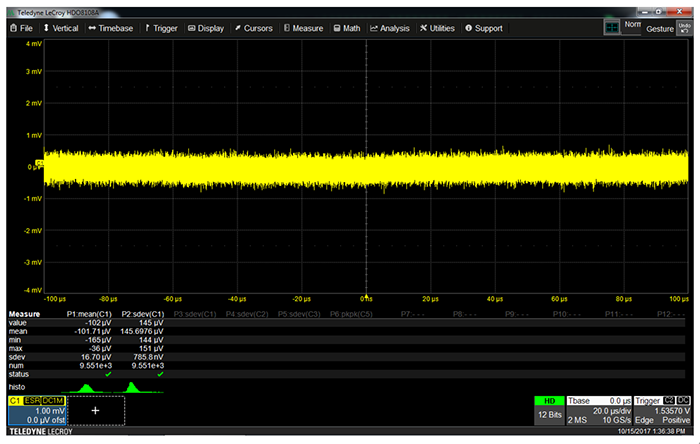
Figure 2: This screen capture shows an acquisition of the inherent amplifier noise of the HDO8108A
Bear in mind, too, that there are a couple of ways to look at noise measurements: the RMS value and the standard deviation (Figure 3). The former includes any DC offset, while the latter subtracts the mean value from each measured voltage before RMS is calculated (square root of the sum of the squares). Thus, the standard deviation is a truer measure of the variation in the noise level.
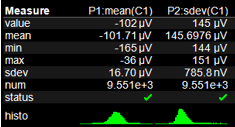
Figure 3: Noise measurements can be thought of in terms of RMS value or standard deviation
From Figure 3, we can see that the standard deviation of the noise-floor trace of Figure 2 is about 145 μV. So now we have an idea of what the scope is capable of in terms of noise measurements.
Now, let's make one of the simplest power-rail measurements we can make: a 1.5 V battery. Considering the electrochemical reactions going on within the battery, and a bit of current draw due to probing, we might anticipate some amount of noise on the voltage trace. So we chuck up our battery in a case, connect leads to it, and run them into the oscilloscope. What comes up on the display is, to say the least, surprising (Figure 4).
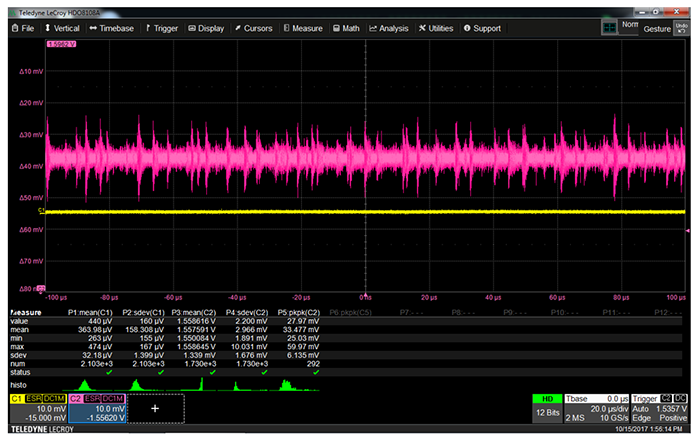
Figure 4: Initial measurement results from a 1.5-V battery
At the top in Figure 4 is our battery (in magenta, Ch2); below that is our noise-floor measurement for reference (in yellow, Ch1), with both on the same vertical scale. We see noise on our battery's voltage, lots of it, and way more than we expected. We're measuring a mean voltage of 1.56 V, 3 V RMS, and a noise level of 33 mV peak to peak.
Not only that, but there appears to be some fairly high-frequency components to that noise as well as a sort of periodicity going on. With our oscilloscope's horizontal time base set at 20 μV/div, we check on the sampling rate, which is at the instrument's maximum 10 GS/s. So we are, indeed, capturing as much high-frequency information as the oscilloscope can capture.
One consistency check we can do is to use the scope’s fast-Fourier analysis capabilities to look at this signal in the frequency domain (Figure 5). From the full-spectrum frequency plot at top, we see that the noise is indeed very wide-band in nature, reaching to the oscilloscope's full bandwidth of 1 GHz with no sign of petering out.

Figure 5: A spectrum analysis view of the battery's voltage measurement
At the bottom of Figure 5 is a zoomed view of the first 100 MHz of the spectrum, and there are clear peaks in the noise, which, curiously, begin at almost exactly 15 MHz, followed by 30 MHz, 45 MHz, and so on. This is undoubtedly man-made RF noise on our battery signal.
Note, as well, that the spectrum analysis is showing an odd phenomenon: even harmonics. This can only happen if the signal source of the noise is distorted, with the waveform anti-symmetric in one cycle. Our noise source, then, is perhaps a clock with some duty-cycle distortion, or differing rise and fall times in its pulses. With the higher harmonics dropping off more slowly than 1/f, our noise source is probably more like a bunch of pulse
The obvious remedy, then, is to provide some shielding for our 1.5-V battery. After carefully wrapping it in aluminum foil, we repeat the measurement, only to find that the noise spectrum is virtually identical to that of the first measurement. Huh?
Then we take a close, careful look at our shielded battery and case, and notice something: only the center conductor of the coax is making contact with the foil. The coax's shield is not; it's floating. And, of course, shielding is only really effective if it is connected to the return path to the instrument's chassis. With that coax shield disconnected from our foil around the battery, RF pickup will be unmitigated and will be transmitted to the signal line almost as it had with no foil at all.
So let's try this again, this time with the coax's shield connected to the aluminum foil. The difference, as seen at bottom of Figure 6, is dramatic. Our noise went from values in the -60 dBm range to the -100 dBm range, representing a 4X reduction. We're talking an amplitude of around 45 nV.
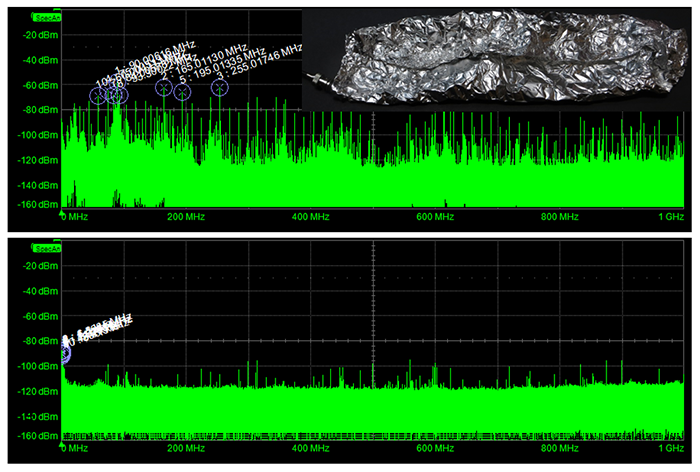
Figure 6: Another spectrum analysis view of the battery voltage (with battery now properly shielded)
As a final sanity check, let's compare our battery noise with proper shielding to our oscilloscope's noise-floor measurement (Figure 7). That's the oscilloscope on Ch1 (yellow trace) and the battery on Ch2 (magenta trace), and they are virtually identical. In fact, the battery's noise is below the oscilloscope's noise floor.
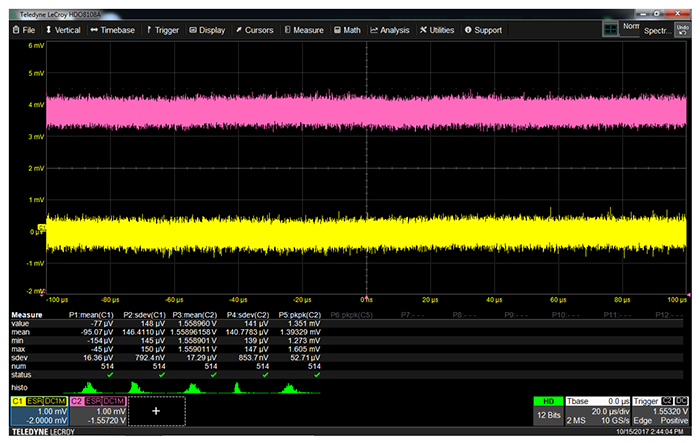
Figure 7: The oscilloscope's noise-floor measurement (yellow) and the shielded battery measurement (magenta) are virtually identical
What, then, have we discovered about how to reduce RF pickup in power-rail measurements?
- Whenever we probe low-level signals with anything other than a well-shielded coax connection, we will be encountering RF interference. Any exposed conductors that are separated from the DUT's shielding are going to act like antennas.
- Moreover, that RF pickup will typically be of a broadband nature. To minimize this aspect, we want our probe's tip to be designed as much like coax as possible. Any inductance in that tip will degrade your measurement bandwidth and probably cause some ringing in your measurements. But what's worse is you will get that "antenna effect" and the probe will be prone to RF pickup. So you want a connection between the oscilloscope and the DUT that looks as much like a coaxial connection as possible.
- In terms of design for test, if you can add test points to your board in the form of micro-coax connectors and then connect your coax cable to those points, you will have gone a long way toward killing any potential for RF interference in your measurements.
Previously published version in the Teledyne LeCroy Test Happens Blog: http://blog.teledynelecroy.com/2018/01/understand-rf-pickup-when-measuring.html