
S-parameters are a set of S-matrices computed or measured at a number of frequency points. Each element of the matrix or S-parameter is a set of complex numbers at each frequency value. They can be plotted as magnitude and angle (Bode plot) as illustrated below for the reflection and transmission parameters for two simple Beatty resonators.
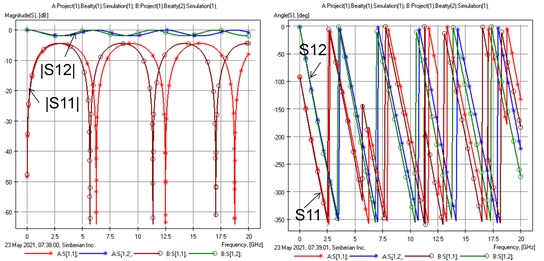
We can observe some shift of resonances in the two structures, but it is difficult to make any conclusion on the angles – they are close at lower frequencies, but then deviate from each other. The jumps can be un-wrapped, but this is not always straightforward for measured data.
Another possible way to visualize S-parameters is to use a Nyquist or polar plot – simply plot the real value of the S-parameter vs. the imaginary at each frequency point and connect the points as the frequency increases. A vector from 0 to each real and imaginary coordinate gives the magnitude and angle of the corresponding S-parameter at that frequency. The same reflection and transmission parameters as above are shown below in polar plot format.
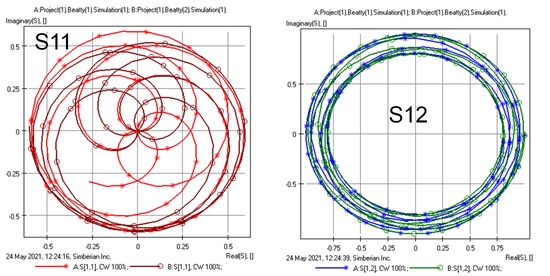
Such plots are even more confusing than magnitude and phase.
If we plot the real and imaginary parts in 3D with the frequency as the Z-axis, we get a much more useful visual perspective of the same dataset. The same S-parameter data as above appears as 3D spiral plots shown below.
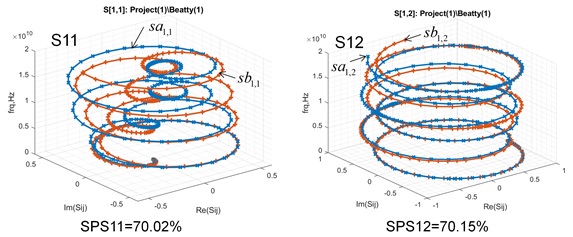
The plots do not overlap as in polar plots and no jumps of angles as in Bode plots. This new visual representation of S-parameters offers a different perspective.
Often times, we use patterns in the S-parameters to identify specific root causes of interconnect behaviors. Using a 3D perspective may help us identify new patterns for which to be aware.