
High Speed Digital (HSD) transmit (Tx) and receive (Rx) circuits are modeled as IBIS-AMI models per the IBIS standard used with associated SerDes channels in SerDes channel simulators to evaluate their system margins. Oftentimes, the SerDes channel is defined with S-parameters which may result in the channel simulator modeling the channel with an impulse response that has excessive high frequency aliasing. An original and better anti-aliasing process is defined for use in channel simulators to eliminate the negative effects of high frequency aliasing without compromising the integrity of the channel characterization. This process preserves the fidelity of the S-parameters up to their highest frequency while eliminating high frequency aliasing at higher frequencies with no added delay.
This paper first gives an overview of high frequency aliasing issues in context with industry standards compliance testing, SerDes systems examples without and with the proposed anti-aliasing algorithm (AAA), and then the AAA is discussed.
High Frequency Aliasing in Channel Simulators
SerDes systems are represented in channel simulators with SerDes channels and IBIS-AMI models per the IBIS Open Forum standard (currently at revision 7.1).
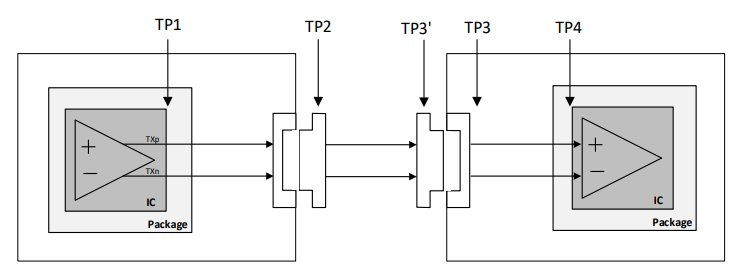
Figure 1 shows a typical SerDes system block diagram to be simulated using a channel simulator.

This block diagram is generic for any channel simulator (CS), but each tool has its specific way to represent this block diagram.
All channel simulators convert the total channel into an impulse response (IR). One of the key problems when setting up a SerDes system design in different CS tools is that each CS tool does not generate the same IR. This fact has been observed by many and especially reported by Romi Mayder of Xilinx Inc. at the 2015 DesignCon conference for the top 6 EDA CSs in the industry. Though this paper is dated, it still applies today. Additional observations have been posted on the web [2][3][4].
Some CS tools produce an IR that has a high level of high frequency aliasing. This is not of concern when an Rx IBIS-AMI model is used which has an input continuous time linear equalizer (CTLE) that attenuates the high frequency aliasing low enough so as to not affect Rx IBIS-AMI output results.
However, there is my SerDes system which requires characterization with a pass-through Rx IBIS-AMI model so that the Tx IBIS-AMI model can be evaluated per industry testing requirements.
For example, consider the Universal Serial Bus 4 (USB4™) Router Assembly Electrical Compliance Test Specification [5].
Also, consider the VESA DisplayPort™ PHY Compliance Test Standard [6].

Figure 3. The Four Ideal Measurement Points in a DisplayPort Interconnect System
In both figures, the four test points are identified as follows:
TP1 – Reference measurement point at the Tx IBIS buffer output.
TP2 – Reference measurement point located at the USB Type-C plug connected to the Router Assembly TX output. Used as a reference point for defining Router Assembly TX.
TP3 – Reference measurement point located at USB Type-C receptacle output on the far end side of passive cable. Used as a reference point for passive installations.
TP4 – Reference measurement point located at Rx IBIS buffer input.
All of these test points do not include the Rx circuit which would have included low pass filtering of any high frequency aliasing.
Thus, testing within a SerDes CD tool that exhibits high frequency aliasing in its IR can lead to misleading CS results and possible non-compliance to the industry standards requirements.
Serdes System Examples
Three SerDes system examples are considered. Since the focus in on the SerDes total channel IR, all systems use a pass-through Tx and Rx IBIS-AMI model and S-parameter files to define the Tx IBIS buffer, Tx router assembly output, and channel passive cable.
All examples use NRZ signaling with 20 Gbps and 32 samples per bit. This implies a sample rate = 640 GHz with maximum frequency 320 GHz. The IR for each example is obtained from one commercial CS and its time domain impulse, impulse frequency domain characteristic, and its eye density plot is observed without and with AAA. Without AAA, the high frequency aliasing is visible in the IR. With AAA, the high frequency aliasing is eliminated with no delay to the IR while retaining the IR characteristics below the S-parameters maximum frequency. All IR displays have time domain data normalized such that a unity impulse is defined by unity amplitude and frequency domain data normalized such a unity impulse has 0 dB gain at 0 Hz. The IBIS-AMI standard reference unity impulse in the context with unity area in a one-time step interval. All IR responses collected from the CS tool, along with the applied AAA, are displayed in the Keysight SystemVue tool for consistent comparison.
The AAA process converts the CS IR to the frequency domain and matches the characteristics below the maximum S-parameter frequency (20 GHz in this case) and reformulates the characteristics above this frequency to eliminate high frequency aliasing while retaining a causal time domain response.
Example 1: Tx with IBIS buffer defined with S-parameters with maximum frequency at 20 GHz and with 1.3 dB loss at Nyquist (10 GHz).
Figure 4 shows the CS IR in the time domain and frequency domain without and with AAA.
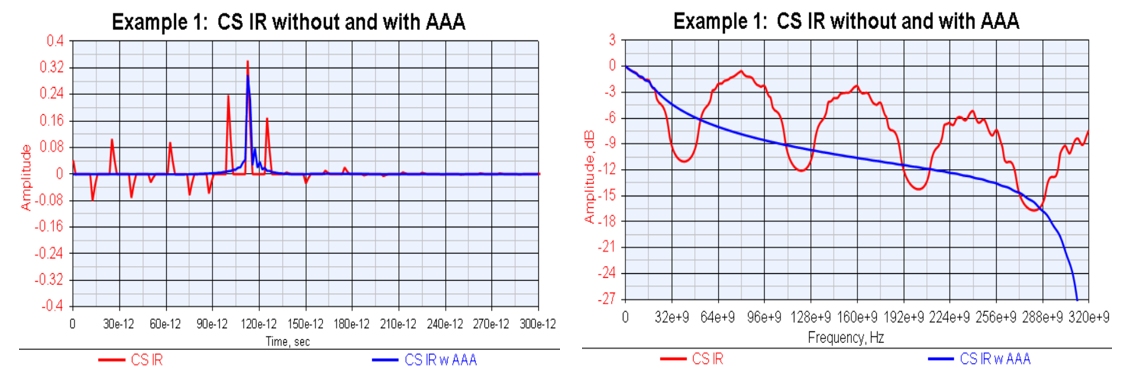
As can be seen, there is a lot of high frequency aliasing in the IR. However, the IR w AAA has no high frequency aliasing and has no additional processing time delay.
Figure 5 shows the CS IR eye density plots without and with AAA.

As can be seen, the IR eye density without AAA has so much high frequency aliasing effects to make the eye density unusable. The IR with AAA has a much cleaner and usable eye density plot.
Figure 6 compares the AAA response to the CS tool IR using the CS tool anti-aliasing filter (AAF) set to have a filter with number of time points = BR*SPB/BW = 32; where BR = BitRate (20 Gbps), SPB = SamplesPerBit (32) and BW = Max S-parameter frequency (20 GHz).
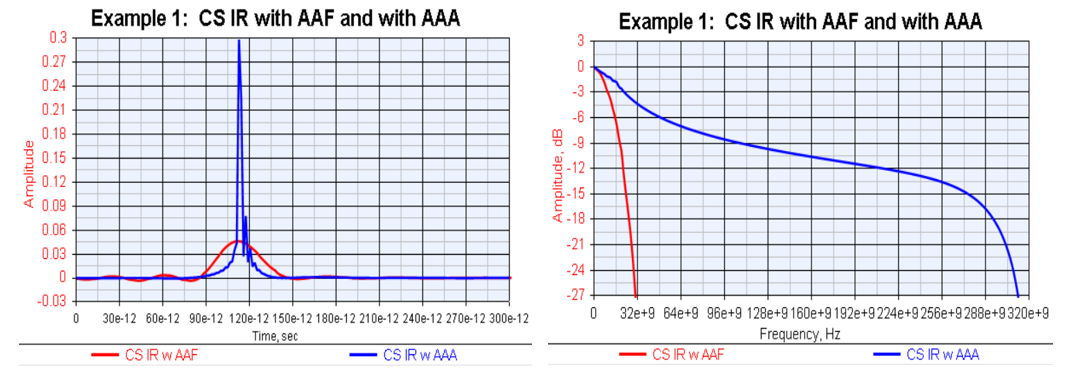
As can be seen, the CS IR with AAF has excessive rolloff and reduced fidelity in the time domain impulse as compared to the CS IR with AAA.