
How well do statistical models predict the behavior of real-world systems? In many signal integrity applications, such as the estimation of random jitter at a given bit error ratio (BER), the given population of a statistical distribution is used to infer a potential future outcome. Similarly, Figure 1 depicts a model predicting the ratio of histogram range to histogram sigma (one standard deviation) for various population sizes of a Gaussian distribution. The prediction indicates that as population grows, the limit of the ratio of range-to-sigma increases.
For example, given a population size of 100 values, the predicted ratio of range-to-sigma is 6.180. However, for a population size of 10,000,000 values, this ratio grows to 11.224. This results in an increased probability of a statistically-significant event occurring within an increasing sample population. As more values are added to the sample population, the chances of an anomaly or outlier being captured within the data set improves.
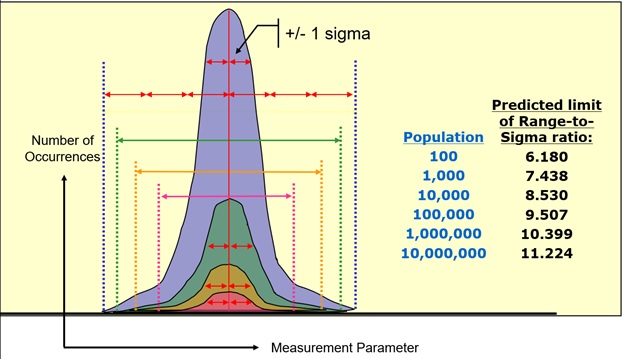
Figure 1: For a given population size, the limit of the ratio of histogram range to histogram distribution can be predicted. The greater the population, the greater the peak-to-peak range-to-sigma ratio.
To investigate the accuracy of the statistical model's predictions heuristically, we used a function generator and oscilloscope to collect varying population sizes of measurement parameter results using a 3 MHz sine wave. The oscilloscope captured multiple acquisitions of the sine wave and measured its cyclic frequency across 1,000 waveform periods (see Figure 2). The oscilloscope also computed the histogram's standard deviation (Parameter P2) and range (Parameter P5).
Note that the ratio of measured frequency to sigma is approaching 0.1%. The oscilloscope used in this experiment has a sample clock jitter specification of 280 femtoseconds rms, which is negligible relative to the sine frequency variation. While a tiny portion of the jitter noise originates from measurement error created by the oscilloscope, the majority of random variation in the sine wave's measured peak-to-peak to sigma frequency is due to the quality of the comparatively lower precision function generator.
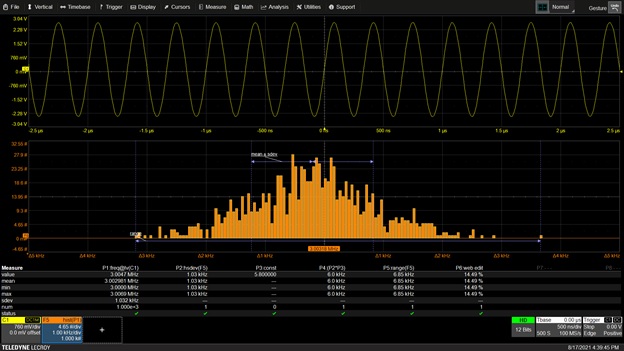
Figure 2: A histogram of 1,000 frequency measurements is collected. Parameter P1 computes signal frequency. P2 and P5 computes the standard deviation and range of the histogram distribution.
A much larger population of 5,000,000 values is collected and shown in Figure 3. A Gaussian shape of random frequency fluctuations emerges in this much more statistically-significant histogram. As the results are different for each collection of data, a series of three test runs is performed and tabulated for each population size.
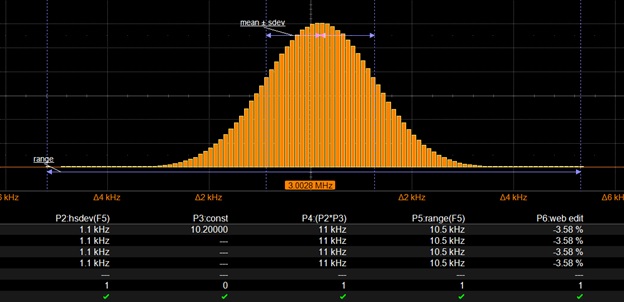
Figure 3: A statistically significant histogram including a much larger population of 5,000,000 cyclic frequency measurements is collected, with results confirming a greater range-to-sigma ratio.
Figure 4 compares experimental results with the model using a semi-log graph. The blue line in Figure 4 plots the predicted model values which were initially given in Figure 1. Experimental results from the three test runs are plotted as the orange, yellow, and purple circles shown in the graph.
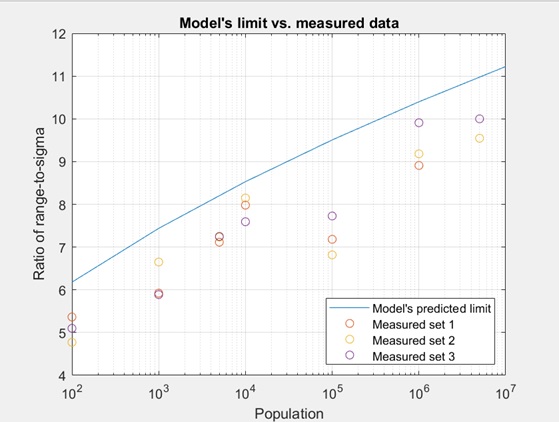
Figure 4: The predicted model from Figure 1 (blue line) along with experimental results (orange, yellow, and purple circles). Experimental results confirm that the model is an accurate predictor of the limit of range-to-sigma values for varying population sizes.
The range-to-sigma ratio limit is predicted by the model to expand with increased population -- for example, the ratio increases from 7.438 to 10.399 when the population increases from 1,000 to 1 million. This was also confirmed in the lab using the data collected from the oscilloscope, providing support that the model is indeed a good predictor of real-world measurement results. This is important for many signal integrity measurement applications, which rely on the extrapolation of a subset of data to predict system behavior. As an example, there could be a one-in-a-billion chance that an edge will arrive too early or too late, resulting in an electronic malfunction in a latched system. By referring to the model relating sigma to peak-to-peak, signal integrity engineers can make predictions about the likeliness and severity of worst-case system behavior.