
The dielectric constant, Dk, of a laminate is an important electrical property needed to accurately design a target characteristic impedance. It will affect the characteristic impedance of a transmission line and the time delay of the line. If you hope to achieve a specific target characteristic impedance on the first pass, it is essential to know the Dk of each laminate layer. Here is a quick, simple way of measuring it
The foundation of Dk
Many methods have been introduced to measure the Dk of a laminate layer, ranging from the insertion loss of 2-line lengths, the Delta L method, resonant stub structures, or even cavity resonant methods. They all provide the capability to extract the frequency dependence of the Dk for specific laminate layers. But they all involve VNA measurements with sometimes sophisticated simulation and analysis techniques or proprietary software. This can be a barrier to a quick or routine measurement.
Sometimes “an OK answer NOW! is better than a good answer late.” If all you need is a value of the Dk to verify a vendor’s specs, or a value to put into a 2D field solver there is a quick and simple way of measuring the Dk with a time domain reflectometer (TDR).
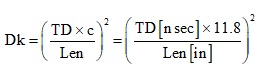
Fundamentally, we just need to measure the time delay, TD, of a fixed length interconnect, Len. The Dk is then given by
Even with a uniform transmission line structure to measure, the challenge is then measuring the time delay and the length accurately. There are three simple approaches to this problem:
- Guess-assume the uniform transmission line begins at the end of the launch which is at the dip in the TDR response
- Measure two different length transmission lines with similar launches and take the difference in length and difference in time delay
- Measure the time delay between two small discontinuities a precision length apart
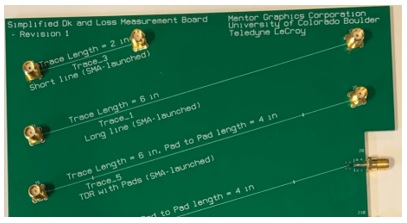
Figure 1 shows an example of a test board with three stripline transmission lines that demonstrate these three approaches. One line is 6 in. long, one line is 2 in. long, and one line is 6 in. long with precision pads in the middle.
When we guess the time delay between reflections from features, there is some uncertainty about where the launch ends and the uniform line begins. There can be as much as 0.05 nsec uncertainty. When the total time delay of the line is 1 nsec, this is potentially a 5 percent impact on the time delay.
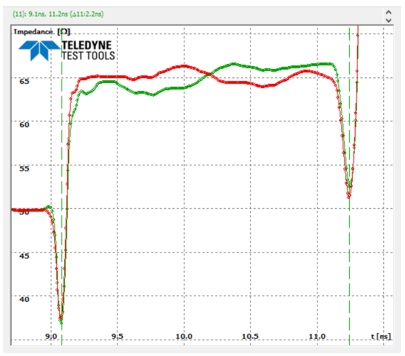
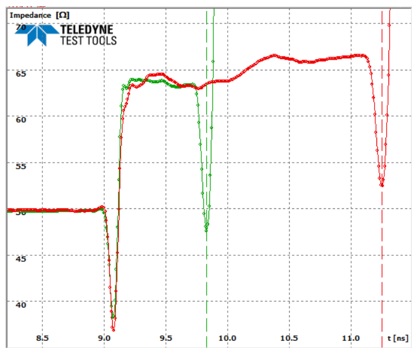
For example, Figure 2 shows the measured TDR response of a nominally uniform stripline transmission line with two through-hole SMA launches on the ends, separated by 6 in. It is measured from both ends. The launches are nearly identical, and there is a small impedance variation down the line. The characteristic impedance of this line is about 65 Ohms.
The extracted Dk is
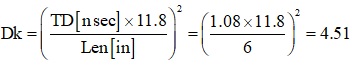
This is the composite bulk dielectric constant of the two layers that make up the laminate material surrounding the stripline trace and between the two planes. If we assume the Dk of each layer is the same, then the bulk Dk for this laminate, composed of glass yarn and resin, is 4.51.
Measuring Dk, Method 2: Two different line lengths
The second method to measure the Dk is to use two different length, but otherwise identical, transmission lines. If they have the same launches, then the difference in time delay between them should be due only to their difference in length.
It is only necessary to use the same feature on each line to determine a round-trip delay time. The difference between the delay in these two lines for the same structure is what is important.
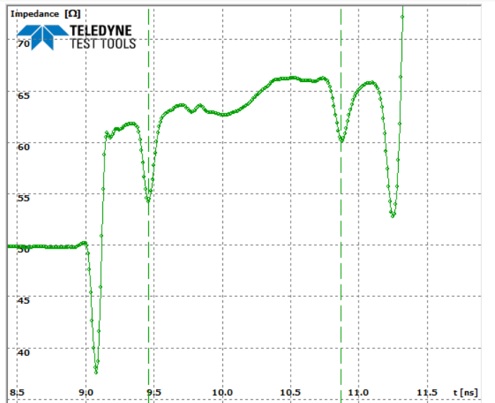
The measured TDR response from a 2-inch long and 6-inch long transmission line is shown in Figure 3. The launches from the ends of the lines are seen to be very similar. This is an important consistency test.
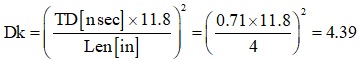
The effective Dk extracted is:
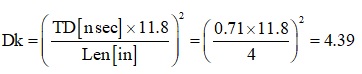
This is the effective Dk for the two layers which make up the stripline structure.
Measuring Dk, Method 3: Special test structure with small pads
The third approach is to build a special transmission line consisting of a uniform transmission line with two small discontinuities strategically placed a precision distance apart. This requires a measurement of only one transmission line structure.
The discontinuities should be far enough away from the launches to clearly see the peaks. This should be at least 2 x RT. In this specific TDR with a 65 psec rise time, this is a 130 psec delay, or 0.8 in.
The distance between the traces should be at least 1 nsec round-trip time, so that the 10 psec resolution can provide a round-trip time delay, or a one-way time delay, accurate to 1 percent. A reasonable distance is 4 in.
The discontinuities can be narrower regions, creating a high impedance, or wider regions, making a lower impedance. It is only necessary that they be visible as a peak or a dip. They should have a length significantly shorter than the TDR resolution so that the peak width is based on the TDR rise time, not the length of the discontinuity.
The resolution of the TDR, with a 65 psec rise time is

A much shorter structure with a large impedance change is preferred. It will result in a well-defined dip or peak.
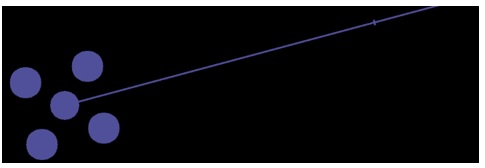
In the test structure fabricated, the length of the extra pad was chosen as 0.05 in. which is ¼ the spatial resolution of 0.4 in. The width of the pad was chosen as 18 mils, which is 3x the nominal line width. Figure 4 shows the artwork for the signal layer with the through-hole SMA launch and the first small discontinuity.
Summary
It should be noted that the two line method and the single line with precision discontinuities, both give the same value of the effective Dk, 4.39.
But the guess method results in a Dk of 4.51. This is higher by 2.7 percent. In the measurement of the single line method, to get the lower value of Dk as measured in the other methods, would have required a shorter measured time delay.
There is inherent ambiguity of where to place the markers to measure the time delay for the 6-inch section. Where on the TDR response does the 6-inch section begin and end?
If better accuracy than 5 percent is required, the two line or the one-line-two-discontinuity method should be used.
Of course, the Dk measured is the effective Dk of the composite structure composed of the two laminate layers above and below the signal line. Extracting the Dk of each layer would require other specialized structures.