
The IEEE P370 standard committee was tasked with writing guidelines for the design of test fixtures for measurement of interconnects up to 50 GHz, defining techniques for fixture de-embedding, and developing techniques and tools for validating the measured or calculated S-parameter data. A preview of the unapproved draft standard (with target date for ballot vote in 2019 ) is described in Reference [1].. This paper discusses the practical aspects of these guidelines, reviews the “Plug and Play” validation kit hardware and S-parameter library files, and illustrates the use of one of the de-embedding techniques described in the standard. It also discusses the S-parameter quality metrics and the tools used for verifying S-parameter integrity, and illustrates their use by way of examples. Note that since the P370 standard is still an unapproved draft, any material included from it in this paper is subject to change.
In this paper, we show a few examples of the practical application of the draft IEEE P370 standard, to demonstrate the effectiveness of the draft standard for interconnect measurement.
(This is a companion piece to IEEE P370: A Fixture Design and Data Quality Metric Standard for Interconnects up to 50 GHz https://www.signalintegrityjournal.com/articles/1169-ieee-p370-a-ffixture-ddesign-and-ddata-qquality-mmetric-sstandard-for-iinterconnects-up-to-50-ghz, which includes fixture design and electrical requirements.)
Calibration Methods
The P370 standard references two commonly-used calibration methods, Short-Open-Load-Thru (SOLT) and Thru-Reflect-Line (TRL). The calibration structures described in the draft standard are compatible with these methods.
De-embedding Methods
The P370 standard describes two methods by which the DUT’s S-parameters may be de-embedded from the measured data which includes the fixtures: the traditional 2x thru method, and a new, “impedance-corrected” method. The former assumes that the two “left” and “right” fixtures that surround the DUT and the 2x thru reference all have identical impedance. However, this is sometimes not the case, which can introduce significant errors in the de-embedded results. Some examples of these problems are described in the Plug and Play Fixtures section later in this paper.
De-embedding Verification
There are a number of approaches that can be used to verify the accuracy of the results of a de-embedding process. Three methods are outlined in the P370 draft standard and Reference [1]:
- Use of synthesized libraries
- Use of Plug and Play test boards
- Use of user-manufactured demonstration boards
Use of the Synthesized Library
With the first method, the user creates an S-parameter for the FIX-2x thru-FIX topology using modeling software such as a 3D field solver or circuit simulator. He or she then chooses the corresponding elements from the S-parameter library provided by the P370 committee, simulates the two networks, and compares the results from the simulated structure to those of the corresponding de-embedded library element. The contents of the S-parameter library are described in [1].
A sample circuit was simulated using the open-source Quite Universal Circuit Simulator (QUCS), which is available at http://qucs.sourceforge.net/, Simulation models were constructed of the 2x thru FIX-FIX and the composite FIX-DUT-FIX using elements from this library. Using the 2x thru simulated model, the DUT can be de-embedded from the composite structure using a candidate de-embedding tool, and the results of the original and de-embedded DUT TDR response can be compared. Examples of the simulated output are shown in Figures 1 and 2. Good agreement was found between the actual and de-embedded in the frequency domain results.
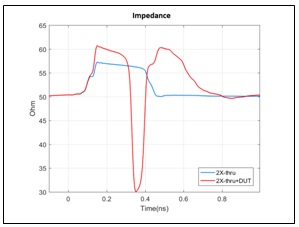
Figure 1. TDR response of the simulated circuit using elements from the S-parameter library
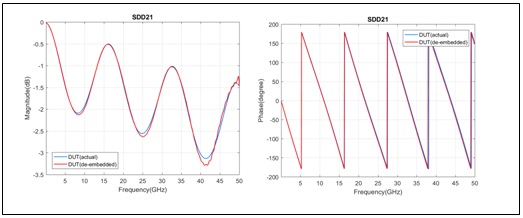
Figure 2. Thru response of the simulated circuit using elements from the S-parameter library
An example of the use of the second method, the use of the Plug and Play fixtures developed by the P370 committee, is included below. The third method, use of user-manufactured demonstration boards, is described in [1].
Plug and Play Fixtures
A number of plug-and-play fixtures, shown in 3, were fabricated. Adapters were inserted so that the DUT can be measured and compared directly with de-embedded results.

Figure 3. Plug and Play board kit example
The general procedure for using the Plug and Play kit to evaluate the de-embedding process and results is as follows:
- Perform a vector network analyzer (VNA) calibration up to the end of the coaxial test cables (NIST traceable reference plane in Figure 3).
- Perform a VNA measurement for all the three configurations shown in Figure 3.
- Use a de-embedding software tool to perform de-embedding, using the results of “FIX-DUT-FIX” and “FIX-FIX” (a.k.a 2x thru).
- Compare the de-embedded results for the DUT against the directly measured DUT results.
- A number of example cases are included below. The configurations of the various cases are listed in Table 1.

Table 1. Plug and Play example configurations
In Case 1, the fixtures (A1+A2) are identical and well behaved, and produce the data shown in Figure 4. The well behaved DUT, a 6 cm microstrip (B1), was de-embedded using the traditional 2x thru method, with results shown in Figures 5. The TDR waveform of Figure 6 is plotted at 50 ps rise time (20/80%).
