

Bogatin’s Rule #9 is “Never do a measurement or simulation without first anticipating the results. If you see something unexpected, don't proceed with the result until you can understand why it doesn’t match your expectation.”
Gustavo Blando from Oracle, presented the Design Con 2018 paper, “Tale of a Differential Pair Measurement,” which beautifully demonstrated the importance of Rule #9.
A simple differential pair measurement gave a result that just didn’t look right to Blando and his team. The differential pair was a short, 3-inch-long, tightly coupled stripline used to characterize the materials in the circuit board. Figure 1 shows the cross section of the uniform differential pair.

Figure 1. Cross section of the uniform differential pair.
When the lines are uniform stripline we would expect the insertion loss of the odd and even modes to have the same insertion loss. While there may be a slight difference in the time delay of the odd and even modes, or a small asymmetry between the p and n lines, creating a small amount of skew, the amount of loss in the odd and even modes should be the same. This is not what was observed. Figure 2 shows the anomaly.
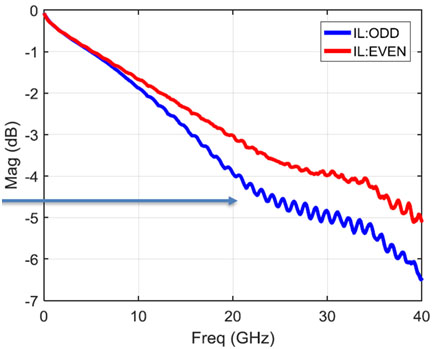
Figure 2. Measured difference in the odd and even mode insertion loss.
Blando’s team was not willing to shrug off this anomaly as experimental error, or a fluke, and just let it go. They doggedly pursued many possible explanations and possibilities, using consistency tests to draw closer to the right explanation and the consequences.
Their most convincing explanation is based on the asymmetry of the current distribution of the signal and return paths in the odd and even modes due to the location of the probe tips launching the signal into the differential pair. This is illustrated in Figure 3.

Figure 3. Asymmetrical current distribution due to asymmetrical probe positions for the odd and even modes.
This asymmetry means that the odd and even modes will see a different path and a different loss.
The most convincing consistency test was to change the location of the ground tip to make it more symmetrical. When the probe was rotated 90 degrees so the ground connection was right behind the trace tip, and the return current was symmetrical for both the odd and even mode current and the insertion loss difference collapsed. Figure 4 shows this result.
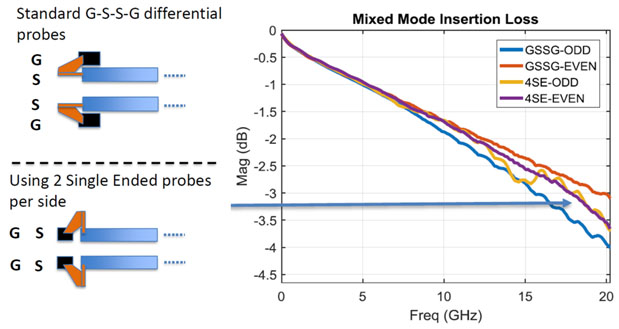
Figure 4. With the return path connection symmetrical to the odd and even modes, the insertion loss difference disappeared.
The important lesson learned from investigating this anomaly can used by anyone who measures differential pairs. Blando suggests two important guidelines. When using microprobes, he recommends using a G-S-G-S-G probe tip that enables a symmetrical current distribution at the launch. Second, he said, “It is important to engineer the launch in an uncoupled region and then de-embed the launch into the beginning of the coupled region.”
This last comment echoes one of the important guidelines the IEEE P370 standards group has advocated. If these two guidelines are followed, it does not guarantee perfect differential pair measurements, but it does help to avoid this perplexing artifact.
Blando’s presentation illustrates the value of never accepting a result if it is not consistent with your engineering judgement. The determination of Blando’s team to resolve this simple problem benefits all of us to enable better differential pair measurements.