

“Do you trust your measurements?” Jason Ellison, Signal Integrity Engineer with Amphenol asked at DesignCon 2019. He and co-presenters, Heidi Barnes, Senior Application Engineer with Keysight Technologies and Jose Moreira, Senior Staff Engineer with Advantest, pictured in Figure 1, answered this question using a special set of test vehicles. “The results were surprising,” Ellison said.

Figure 1. Presenters, from left to right: Heidi Barnes, Jason Ellison and Jose Moreira.
They presented their work in their talk, “S-Parameter Measurement and Fixture De-Embedding Variation Across Multiple Teams, Equipment and De-Embedding Tools”
As part of the continuing work of the IEEE P370 standards committee, a series of “plug and play” test boards were constructed, as shown in Figure 2. These board are available from Signal Microwave. One set of boards was distributed to seven different participating groups who used their own VNA, cables, calibration procedure and measurement process to measure the 2-port S-parameters up to 60 GHz of selected board. These groups performed their measurements over a period of 8 months as part of a round robin study.

Figure 2. The IEEE P370 Plug and Play reference kit, available through Signal Microwave.
Of the seven groups, five of them turned in measurements in close agreement with each other, while two provided measurements of the exact same boards which were outside the distribution. As an example, Figure 3 shows the collection of these seven measurements. While the agreement looks close by eye, the differences are as much as 5 dB in the return loss in some frequency ranges.
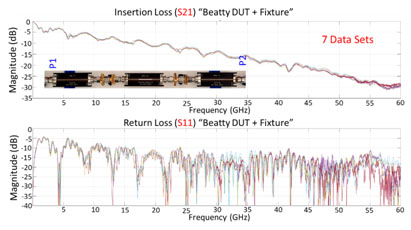
Figure 3. The measured insertion and return losses from seven different groups of the same structure, shown in the insert.
What is not shown is the phase differences between the various measurements where most of the variation lies, Ellison said. To account for both the magnitude and phase differences, the error vector metric was used to compare different datasets.
This is the magnitude of the vector difference between the two S-parameter datasets with the largest difference, at each frequency, plotted in dB. Including all seven groups created too large a variation. Removing the two outliers and including just the five remaining groups resulted in a maximum error vector amplitude as shown in Figure 4.
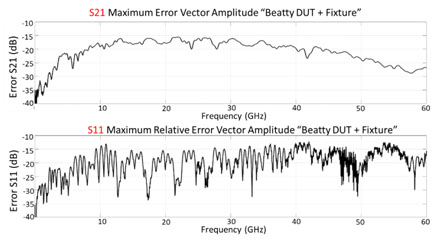
Figure 4. The maximum error vector for insertion and return loss of the five closest measurement sets.
This figure of merit says that the highest frequency for which the variation between the five closest data sets for the insertion loss is within -20 dB of each other, or within 10% agreement, not including the two outlier sets, is about 9 GHz. This is not very high, considering the measurements are up to 60 GHz. The -20 dB threshold for the return loss has an even lower bandwidth.
Detect potential measurement problems by evaluating the Quality Check
The two outlier datasets, removed in this comparison, had other noticeable problems in their measurements. In particular, Ellison says that the S-parameter quality check values for passivity, reciprocity and causality would have identified these data sets as having quality problems. If this metric were calculated at the time of the measurement, it would have flagged these measurements as suspect and they could have been taken again, or the VNA re-calibrated.
“Just because someone has a VNA capable of 60 GHz bandwidth doesn’t mean it will always give the same results,” Barnes said. It is not the instrument, but the measurement procedure that seems to influence the quality of the measurements the most.
For example, Barnes suggested seven important steps to improve the quality of routine VNA measurements:
- Calibrate your VNA per the manufacturer’s guidelines
- Inspect all connections visually and for measurement stability, replace as needed in the DUT, cables, and cal kits. Cables can age with use. Measure the cables before calibration to verify the quality of the cable.
- Use proper adaptors.
- Choose the right number of points for IFFT and set an appropriate IF Bandwidth. Use the same start and step frequencies for the most stable IFFT.
- Use “Unknown Thru” VNA calibration technology
- Post-calibration stability check: don’t bend the cables or it introduces phase errors. Check the measurements for mechanical stability of the system.
- Compare the results against a known reference, such as the P370 Plug and Play kit.
How good are de-embedding tools?
Included in this study was a comparison of the results from the de-embedding algorithm of four different commercially available tools. The same set of data using a 2x thru fixture and a Beatty standard DUT were used as input to four de-embedding tools.
“The de-embedding tools correlate really well,” Ellison said. When they were used to de-embed the DUT, the agreement among the tools was a deviation of less than -30 dB error vector magnitude up to almost 60 GHz in the insertion loss. This is shown in Figure 5.

Figure 5. The magnitude of the error vector between the different de-embedded DUT S-parameters. The agreement is excellent.
Acting on the same data set, the four different de-embedding tools give almost identical results. Ellison recommended that whenever performing a fixture de-embed, it’s always important to check the consistency of the results using two of the P370 recommended tests:
- Compare the TDR response of the fixture model with the fixture-DUT-fixture measurement
- Compare the self-de-embedded 2x thru fixture with a transparent interconnect.
The next step for the IEEE P370 group is to perform a similar round robin measurement series using the new differential plug and play boards, recently produced by Signal Microwave. Figure 6 shows this kit recently made available.
Figure 6. The new differential plug and play kit available from Signal Microwave, displayed by Heidi Barnes.