
This is a summary of the DesignCon 2017 paper, “New Characterization Technique for Glass-Weave Skew,” which can be downloaded here.
The glass weave skew effect, sometimes referred to as the fiber weave effect, is an increasingly important problem with ever higher data rate serial links. The problem is the additional time delay skew introduced on one line of a differential pair due to local variations in the Dk. This causes a collapse of the eye from the increasing loss of the differential signal with frequency and the creation of a common signal which may introduce additional problems. The impact becomes larger with higher data rates.
Because of its statistical nature, predicting this problem is difficult and testing for its root cause is often ambiguous. While there are a number of mitigation techniques, they each carry a cost burden. Determining which method has the best cost-performance tradeoff requires measuring the magnitude of the problem and the benefit of each solution.
This article summarizes a technique developed by my group at the University of Colorado, Boulder (CU), and introduced at DesignCon 2017 to measure the magnitude of the glass weave skew effect and an observation of an important hidden variable which might explain why there is so much confusion about this effect in the industry.
The Glass Weave Skew Effect
Printed circuit boards are made with combinations of woven glass yarns impregnated with polymer resins. Figure 1 is a cross section showing the bundle of glass fibers with a signal line adjacent. The glass fibers have a DK of about 6.7 and the resin typically about 3.2. The fiber bundles are on the order of 8 mils in width, comparable to the typical line widths of 5 mils. This means a signal line’s effective DK will depend on the local distribution of glass and resin.
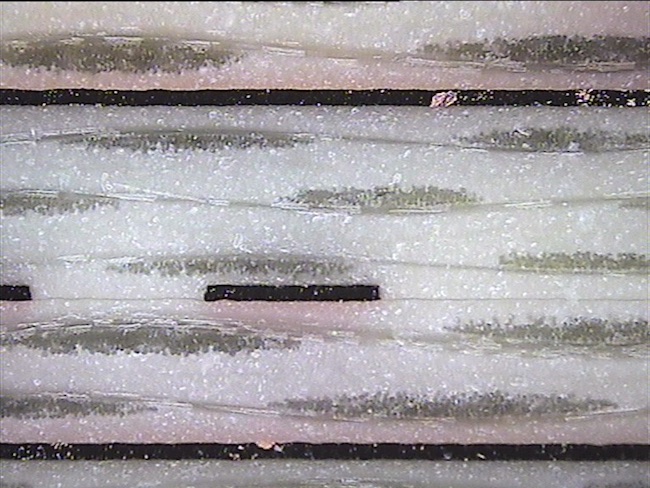
Figure 1. Cross section of a board showing the glass fiber bundles of comparable size to the 8 mils wide signal line.
In the board manufacturing process, the glass yarn is aligned parallel to the edge of the board. In the routing process, signal lines are typically routed parallel to the edge of the board. This forces the signal lines to be routed along one of the glass yarn weave directions. When one line of a differential pair happens to fall over a glass bundle it will see a higher DK and a longer delay, compared to its neighbor which might fall between two glass bundles and see a lower DK, and a shorter delay. Figure 2 shows the measured delay of two lines in a differential pair with one line delayed 60 psec compared to the other.
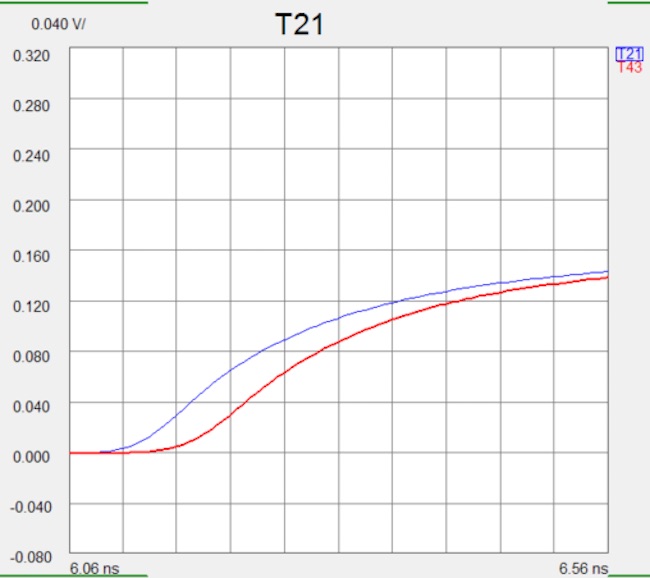
Figure 2. Measured time domain transmission (TDT) of the two lines in a differential pair showing as much as 60 psec delay skew.
In a typical channel, the maximum allowed line to line skew is about 20% of the UI. At 10 Gbps, this is 20 psec. The channel in Figure 2 would have failed.
To first order, we would expect the glass weave skew to scale with length. This offers a useful metric for the glass weave skew in units of delay per inch. For a channel 20 inches long, and a maximum allowable delay skew of 20 psec, the delay per inch must be less than 20 psec/20 inches = 1 psec/inch for a 10 Gbps channel. For a 20 Gbps channel, the maximum allowable delay per inch is 0.5 psec/inch.
Measuring Delay Skew
The technique developed by my group at CU, Boulder, in conjunction with Nanya, is based on measuring the time delay of many, nominally identical, 6 mil wide lines, each with a slightly different relative overlap between the signal line and the underlying glass weave. We use a fixed pitch of the signal lines of 45 mils, determined by the pitch of the mounting holes used in our manual probe. The typical glass weave pitch is on the order of 15-20 mils.
If one line happens to be over a glass bundle, the next one, with a center to center spacing of 45 mils, will not be. As we move down the set of 40 lines, we will see a periodic overlap and shift of the signal line to the underlying glass bundle. This Moiré pattern will appear as a periodic pattern of longer and shorter delays of each line. The peak-to-peak value of the delay is a measure of the worst-case time delay skew expected for that signal line width and glass-resin laminate system.
We use four sets of 40 lines each. One set is a microstrip along the glass weave axis. This should show the fiber weave effect. Another set is an identical 40 microstrip lines rotated 15 degrees to the glass weave fibers. These lines should NOT show the fiber weave effect and act as a reference. These two sets of microstrip are repeated as striplines in the bottom half of the board. A view of one test board with these four sets of lines is shown in Figure 3.
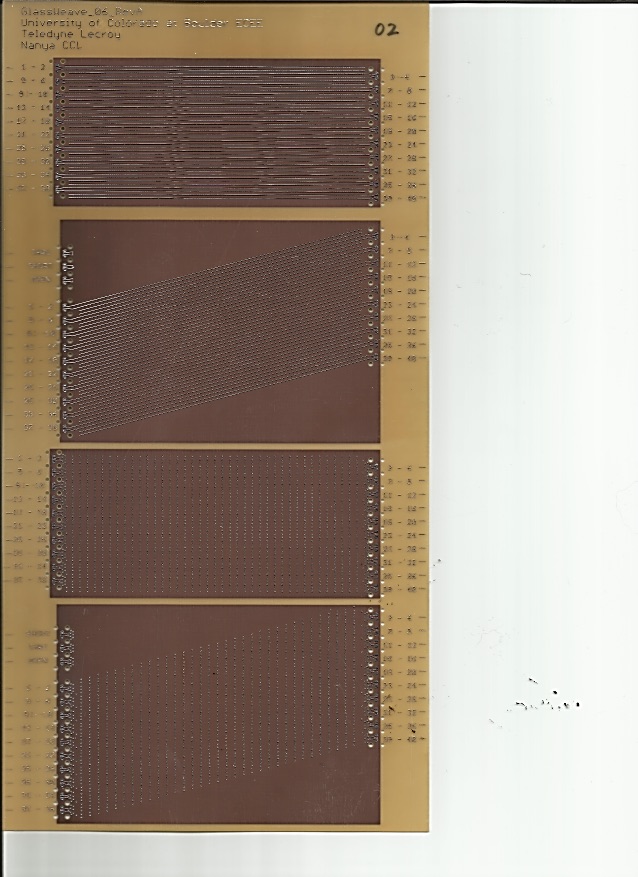
Figure 3. The test board with four sets of 40 lines along the glass weave direction and rotated 15 degrees to it in microstrip and stripline.
We use microprobes to connect to a Teledyne LeCroy SPARQ Network Analyzer to measure the return loss of each line. The end of each line is open, so the return loss has information about the round trip delay of each line. We calculate the peak position of the impulse response of the return loss of each line. This allows us to measure the absolution delay of each line with a resolution of 42 fsec.
With this method, we are able to resolve the 160 fsec rms jitter in the time base of the network analyzer and the impact of the roughly 0.9 mil reproducibility of the alignment of the test board in the CCN nTegrity fixture.
As part of their training, my graduate students spend considerable time analyzing the repeatability and reproducibility of every measurement system to build confidence in the final measurements. Figure 4 is an example of one of my students, Dharma, performing measurements with the complete system.
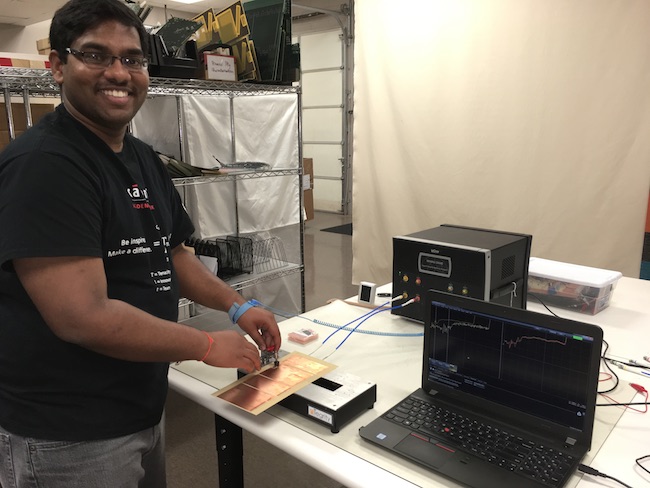
Figure 4. My graduate student, Dharma Teja Paladugu, measuring a board with the CCN nTegrity fixture and Teledyne LeCroy SPARQ.
Interpreting the Measurements
We measure the absolute delay of each line in the set of 40 lines for the lines aligned with the glass weave axis and at 15 degrees. For the lines which are rotated 15 degrees, we routinely measure a variation in the delay of roughly 0.08 psec/in rms. With each line about 4 inches long, the delay per inch (1/the speed), is about 160 psec/inch. This variation corresponds to each line having the same delay within 0.08/160 = 0.05%. About half of this is the variation from alignment in the fixture. The rest is the inherent line to line differences from manufacturing. This is an incredibly low variation.
When the lines are aligned along the glass weave axis, we see a periodic variation in the delay exactly as expected due to this Moiré effect of the shifting relative overlap of the lines to the underlying glass bundles. Figure 5 is an example of the measured delay skew for two sets of lines, 1 ply of 1067 glass showing 6.5 psec/inch and 1 ply of 2116 glass showing 2.67 psec/inch.
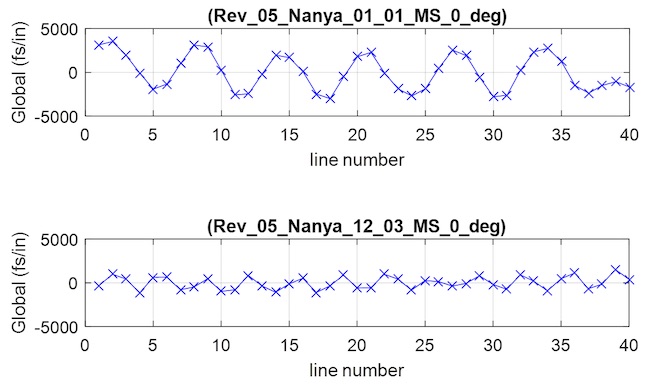
Figure 5. Top: Measured delay skew for each of the 40 lines, using 1 ply of 1067 glass. Bottom: Measured delay skew for each of the 40 lines, using 1 ply of 2116 glass.
The technique we developed gives very reproducible measurements of the intrinsic glass weave skew expected for the specific 6 mil wide line used in these test lines. With it, we can evaluate any glass-resin system.
An Important Artifact
After we established confidence in the measurement system, we noticed some unexpected anomalies. Some of the comparisons of microstrip to stripline, or 1 ply to 2 ply, did not seem right. Investigating this effect, we uncovered a very important hidden variable which we believe will have profound impact on how glass weave skew is measured and mitigated.
A close inspection of one board revealed that the glass weave yarn is not precisely aligned to the edge of the board, to which the signal lines are precisely aligned. Figure 6 is a close up of a microstrip trace showing this very slight misalignment.

Figure 6. Close up of six microstrip lines showing the dark fiber bundles underneath which are at a slight angle to the signal lines.
We expected the glass bundles to be align to the signal traces, but to our surprise, there was a slight misalignment. This means that if a signal line started out over a glass bundle, in traveling a short distance, it would soon be over resin. Even though there could be a large difference in the local Dk over glass or over resin, this would be completely masked by the averaging from the slight misalignment.
We could only measure the signal line to glass bundle alignment on microstrip lines, and then only when the lines were along the weave direction and not the fill direction. Figure 7 summarizes our measured misalignments for the 41 boards we used in our study.
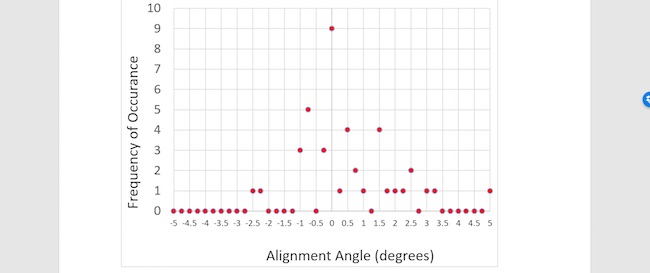
Figure 7. Measured glass weave to signal line alignment in the 41 boards used in this study.
If the misalignment causes a line to start centered over a glass bundle and end up centered over resin, the glass weave skew effect will be completely averaged out. Using 16 mils as the glass bundle pitch, the misalignment angle which smears out the effect is 0.008/4 = 2 mradians or 0.1 degrees.
While some of boards have an alignment close to the 0-degree alignment expected, the standard deviation is about 1 degree. Some of the boards have misalignment more than 2 degrees! And it only takes a misalignment of 0.1 degree to impact the measured glass weave skew effect.
For our study we restricted the final reported measurements to only those boards with a measured alignment to within about 0.1 degree, an alignment near the limit to what could be measured. This also meant, we could not use any of the stripline results as we had no way of measuring the misalignment of the signal line to either glass yarn layer in the stripline laminate.
Based on a simple model for the smearing out of the measured delay skew effect due to a misalignment, and assuming an actual delay skew of 5 psec/inch in every board, we were able to match the distribution of measured delay skew values for all of our boards as due solely to the misalignment artifact. Figure 8 shows this analysis.

Figure 8. Comparing the measured delay skew of each board and the specific misalignment, as dots, compared to a simple model predicting the smearing out of the measured delay skew.
Implications for the Industry
The identification of this hidden variable artifact has serious implications for both reported measurements of delay skew in the industry and the impact of glass weave skew in production boards.
If the actual glass-bundle to signal-line alignment is not measured or reported in any glass weave skew measurement, the interpretation of the results is ambiguous. It would set the upper limit to what the glass weave skew could be, but cannot be used to directly compare the benefit of one glass weave style or mitigation technique to another. This hidden artifact has introduced a considerable noise source in the database of reported measurements of glass weave skew. We have to relook at all past reported measurements.
Only this one production run of boards has been carefully measured. If this is an indication of the typical misalignment of glass weave to board edge, then this might explain why glass weave skew problems are under reported in the industry. For a line 20 inches long, and a glass weave pitch of 20 mils, a misalignment of 0.5 mradians, or 0.03 degrees would begin to smear out the full glass weave effect.
If the intrinsic glass weave skew effect were 5 psec/inch and the channel were 20 inches long, and we require less than 20 psec skew, then a misalignment of more than 0.15 degrees will eliminate the glass weave skew problem. It would only be in those boards that happened to have a misalignment less than 0.15 degrees which would have a potential glass weave skew problem.
This problem could become a valuable feature to the laminate vendor- fabricator who can control the misalignment. If the source of this variation can be found and controlled so a precision alignment between the glass weave bundle and the board edge can be set as 1 degree, for example, it could completely eliminate the glass weave skew problem with no cost adder.
One additional problem introduced by a small alignment might be the Block Wave effect on the insertion loss of traces. This is a topic for a follow on investigation.
Summary
A new technique has been developed and characterized which can measure the glass weave skew sensitivity of a signal line and any glass yarn-resin system. The intrinsic sensitive is better than 0.08 psec/inch. We’ve measured the glass weave skew effect in a few laminate structures, ranging from 7 psec/inch to 0.8 psec/inch.
During this project, we found that the glass weave and traces were not precisely aligned but could be misaligned by as much as 3 degrees. This misalignment can completely smear out the intrinsic glass weave skew effect and should be taken into account when analyzing the results of any measurement.
If it can be controlled, a small precision misalignment may eliminate the glass weave skew problem with little to no cost adder.
This is a summary of the DesignCon 2017 paper, “New Characterization Technique for Glass-Weave Skew,” which can be downloaded here.