

Why We Care About Loss
At data rates above 10 Gbps, channel losses dominate performance and will often determine if a channel is acceptable or not. This is why being able to turn laminate properties into accurate simulations is so important, and why this topic is the focus of the special High-Speed Digital Symposium at the upcoming 2017 EDI CON in Boston.
One of the popular techniques used to measure the losses in a channel is to build a simple test coupon designed to be measured with a VNA. This means having a 2x thru structure to de-embed the launches and a uniform region of differential pair trace.
2-port or 4-port?
One challenge with this approach is that measuring a differential pair requires a 4-port VNA or TDR. This is a lot more expensive than having to measure a single-ended trace which only needs a 2-port VNA or TDR. Will a single-ended test coupon measure the same loss as a differential pair test coupon?
My first reaction is that in microstrip structures, no. Afterall, in microstrip, the closer the traces, the more field lines in air, and the lower the dielectric loss. However, if you are worried about losses in microstrip traces in the multi-Gbps regime, you will have more serious problems you should worry about first, like far-end cross talk. It’s almost a moot point.
But what about in stripline structures? Will a single-ended trace measure the same total loss as a tightly coupled differential pair? Is the difference worth the extra cost of a 4-port measurement? Take a few minutes before reading on to do your own analysis.
Total Loss in Differential pairs
In the absence of coupling, the differential insertion loss of a differential pair is exactly the same as the single-ended loss of either line, providing the two lines are identical. This is easily seen in the relationship between the differential insertion loss and the various single-ended S-parameters:
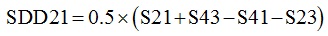

When the coupling, S41 and S23, are zero, so they are uncoupled, SDD21 = S21. This means, if we measure SDD21, we can get the single-ended performance by using an uncoupled differential pair. This just makes comparing different configurations easier.
To explore the question of whether an uncoupled differential pair gives the same loss as a tightly coupled pair, I used the Polar Instruments SI9000, the easiest to use 2D field solver that also includes the frequency dependent dielectric properties and the frequency dependent conductor losses. Under the hood, it solves Ampere’s equation at each frequency to calculate the current distribution in each conductor trace and the impact on series resistance and conductor loss from coupling.
Simulating Total Loss
The first step is to simulate the total loss for a lossy channel, in an uncoupled differential pair. The SDD21 of this configuration will be the single-ended insertion loss. Figure 1 shows the cross section and the parameters for this channel. I selected a 5 mil wide line, with 0.5 oz copper, roughly 100 Ohm differential impedance, 50 Ohms single ended impedance, with a spacing 10x the line width, 1-inch long. I used FR4 parameters of Dk = 4 and Df = 0.02, with a causal dielectric model.
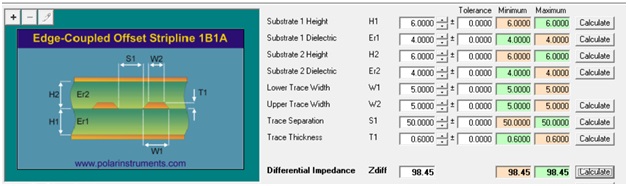
Figure 1. Set up for the uncoupled 100 Ohm differential pair.
The as-designed differential impedance is 98.45 Ohms, close to the 100 Ohm target.
I drill into my students, Rule #9: never do a simulation without first anticipating the result. As a rough rule of thumb, the attenuation in a lossy channel like this should be about 0.1 to 0.2 dB/inch/GHz. What will happen when we bring the lines that make up this differential pair closer?
If all other parameters are kept the same, we will expect the differential impedance to drop, since coupling increases and this decreases the odd mode impedance. To first order, I would not expect the dielectric loss to change, as the fields see the same material distribution independent of their pattern. Will the conductor loss change?
It’s true that the current distribution in the signal conductors will change a little. When the traces are uncoupled and independent, the current distribution in the signal path will be symmetric in the signal trace and spread out roughly 3 line widths in the top and bottom return planes.
When the traces are brought close together, the current distribution in the signal paths will re-distribute, to be a little higher density at their inside edges. This would increase the series resistance a little bit.
However, the return currents in the two planes from the two lines will overlap a little and reduce the series resistance of the return path. That’s as far as my intuition can go. I don’t know which effect will dominate or whether these two effects cancel out and there is no change in the series resistance. This is why we use the simulator, to act as our “virtual prototype.”
Single-ended or Tightly Coupled
Using the Polar Instruments SI9000 tool, we simulate and export the 4-port S-parameters of the two cases: uncoupled, representing the single-ended case, and tightly coupled differential pair, with a spacing equal to the line width. Then, I bring the two touchstone files into my favorite, free, S-parameter analyzer tool, QUCS, and compare their differential insertion loss. Figure 2 shows the simple circuit to extract and plot the SDD21 term from the single-ended .s4p file.
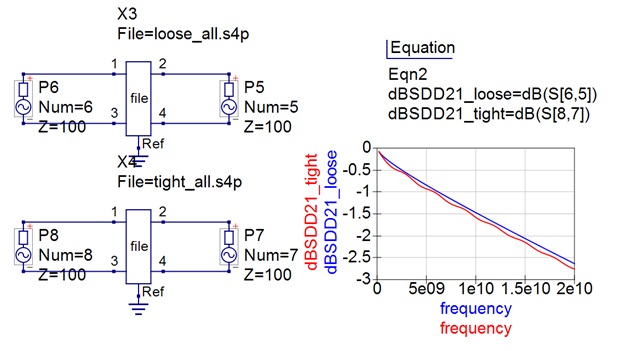
Figure 2. Differential insertion loss of the two test cases pulled into QUCS and plotted.
We expected an attenuation of about 0.1 to 0.2 dB/inch/GHz. Both traces are 1-inch long. Looking at 10 GHz, we see the attenuation is about 0.15 dB/inch/GHz, right in the ball park of what we expect. This is an important consistency test.
There is a difference between the two cases. The tightly coupled trace, in red, has higher loss than the uncoupled case, in blue, and it has ripples. The ripples, of course, are due to the impedance mismatch. When the traces are brought closer together, the differential impedance drops from 98.5 Ohms to 86.8 Ohms.
This impedance mismatch with the 100 Ohm ports, causes the ripples. We can eliminate this artifact and look at the channel attenuation, which is an intrinsic metric of the channel loss, by changing the port impedance to match the line. Figure 3 shows the insertion losses of the two channels with port impedances to match the differential impedance of the lines. There is still a slight difference, with the tightly coupled channel showing a little more loss than the single-ended lines.
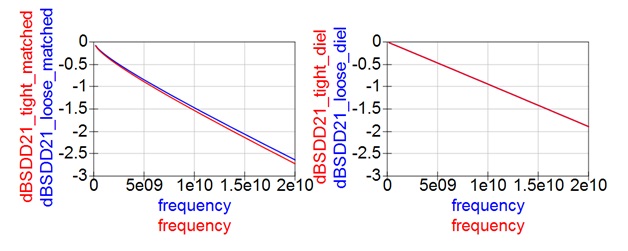
Figure 3. Left: the intrinsic differential insertion loss with the port impedances matched to the differential impedances. Right: with conductor loss turned off, showing the impact from dielectric loss only.
We expected no difference in the dielectric loss between the two cases. To confirm this, I turned off the conductor loss by making the copper conductivity 10,000x higher. The second plot in Figure 3 shows that the attenuation from the dielectric loss in the single-ended and tightly coupled cases are identical, as expected. This suggests the difference is due to the current distribution and conductor loss.
To confirm this, I turned off dielectric loss by making the dissipation factor 0.0001 and re-simulated the two cases. Figure 4 confirms that the insertion loss due to only conductor loss is slightly higher in the case of tightly coupled differential pairs than when uncoupled. The impact from the higher current density from the proximity of the two traces dominates over the small amount of cancelation of return current in the planes.
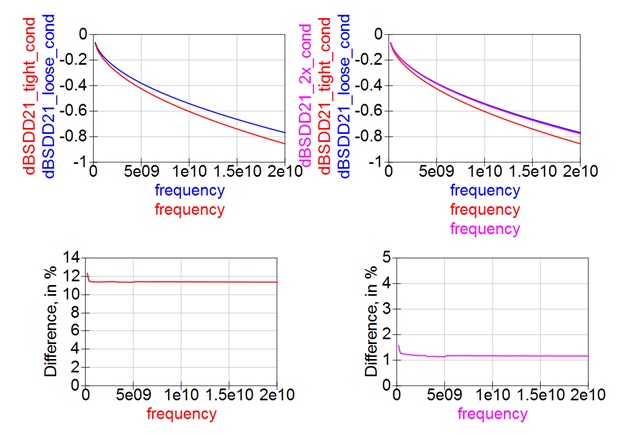
Figure 4. Impact on differential insertion loss from conductor loss only in the case of tightly coupled, left, and a spacing 2x line width, right.
By taking the difference between these two cases, compared to the attenuation in the single-ended case, I calculate the percentage increase in loss from just the conductor loss, also shown in Figure 4. In this worst-case configuration, it is about 12% higher conductor loss. In low dielectric loss systems, the conductor loss dominates and it is possible for the loss measured from the single-ended trace to show a 12% lower loss than the tightly coupled differential test pattern. This is a significant difference.
The answer to the question posed at the beginning is yes, there can be as much as a 12% difference in the loss extracted from a single-ended test pattern compared to a tightly coupled test pattern even in stripline. If 12% accuracy in extracted loss is important, it may be worth it to use a 4-port measurement of a differential pair structure.
But if loss is that important to you, maybe you should consider using loosely coupled differential pairs. This will enable a wider line for the same impedance as the tightly coupled case, and the proximity effect of the higher current density will be less.
To test this idea, I re-simulated the conductor loss with a spacing between the two lines in the pair for 10 mils, 2x the line width. Also shown in Figure 4 is the comparison of the port-normalized differential-insertion loss of these three cases.
While there is a 12% increase in conductor loss going from uncoupled to tightly coupled, keeping the line width the same, when going from uncoupled to a spacing equal to 2x the line width, the increase in conductor loss is about 1%.
Conclusion
If your channel uses tightly coupled traces, you should probably use a tightly coupled differential pair test pattern in your coupon to extract the losses in order to capture a more accurate value of the contribution of conductor losses. You may have to bite the bullet and pay the cost of a 4-port VNA or TDR.
However, if loss is that important to you, you probably should consider using differential pair traces that are loosely coupled, with a spacing twice the line width. This enables using a wider trace for the same impedance, reducing the conductor loss, and reducing the current crowding effect and further reducing the conductor loss.
If your differential pairs in your board are loosely coupled, the single-ended test pattern will give a loss measurement within 1% of your differential channel. Probably not worth the extra cost of a 4-port measurement.
So, should you use a differential pair in your test coupon and pay for a 4-port measurement, or use a single-ended test line and only pay for a 2-port measurement?
Like all signal integrity questions, the answer is, “it depends.” But by putting in the numbers, we are able to answer this “it depends” question and evaluate what it depends on.