A single word illustrates why Bode plots cannot be the only voltage regulator stability assessment method you need to use
Preceding the words voltage regulator with “fixed” is sufficient proof that the Bode plot cannot be our only assessment method. The fixed output voltage regulator does not provide an accessible point to either inject a signal or to measure the Bode response of the control loop [1, 2]. As a result, these fixed voltage regulators are often not assessed for stability margin and, unsurprisingly, are often found to have poor stability. Fixed regulators absolutely need stability assessment just as much or more than variable output regulators. Of course the fixed voltage regulator is not alone in this predicament. Other devices such as voltage references, integrated POLs, simple switchers, integrated class D audio amplifiers and many other devices fall into this category as well. They simply lack access to the feedback loop, prohibiting the use of the Bode plot for assessment, thereby eliminating it as potential measurement solution.
There are other conditions that can prohibit the use of Bode plots as well [3]. Some examples include opamps, which while the loop might be accessible can have bandwidths that are too high to allow injection without influencing the measurement result. Other examples include hysteretic regulators, as well as regulators with multiple control loops, which might only provide access to one of several of the control loops [4].
Another circuit that cannot make use of a Bode plot is an input filter with a switching regulator. The switching regulator presents a negative resistance which can easily oscillate when connected to an input filter. This stability issue was popularized by R.D Middlebrook in 1974 and the minor loop gain assessment method was devised in order to assess such applications [5]. This has become a very well researched and published topic within the academic electronics community.
There are also many applications, and it seems more as time goes on, where there is limited physical access does not allow injection access or space for the probes. An example of such a regulator is shown in Figure 1.
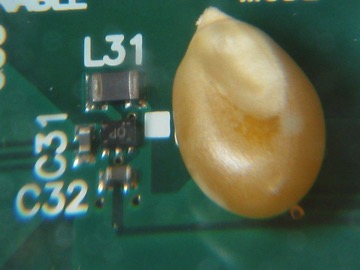
Figure 1 A recently introduced switching regulator along with a single popcorn kernel clearly showing the limited access for injection and measurement probe for stability assessment. The POL regulator also lacks access to the feedback loop.
The work of Bode concludes that if a control loop simultaneously has positive gain margin and positive phase margin the circuit is assuredly stable, which only assures that the circuit will not oscillate. The Bode plot may not be a reliable indicator of relative stability. Stating this more simply, a circuit which has a greater phase margin is not necessarily more stable than a circuit with a lower phase margin. [6, 7]
An illustrative example
The Bode plot of a switching DC/DC “brick” converter, measured with the OMICRON Bode 100 VNA, is shown in Figure 2. A schematic diagram of the converter is not available; however, the availability of external remote sense connection provides access for injection and measurement of the Bode plot.
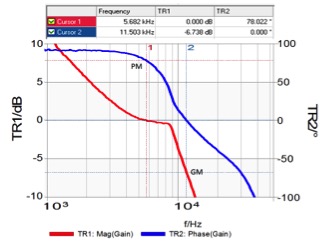
Figure 2 Bode plot of a DC/DC converter.
The phase margin of this converter is indicated as 78 degrees and the gain margin is 6.7dB. These are both reasonable margins and would be interpreted as a stable control loop. A step load response of the converter is shown in Figure 3and the voltage response would seem to contradict the stability of the control loop as determined by the phase/gain margins.
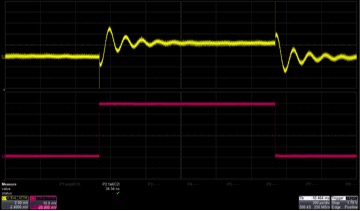
Figure 3 500mA Step load response of the DC/DC converter. The upper trace is the output voltage at 2mV/div. the lower trace is the current step at 100mA/div and the timescale is 200us/div. The rise and fall time of the step are 35ns.
The Nyquist plot as an alternate assessment method
The Bode 100 can display the Bode plot measurement as a Nyquist plot simply by selecting Nyquist from the Format menu as shown in Figure 4.
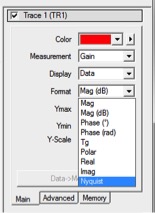
Figure 4 The Bode 100 Format menu offers Nyquist as a display type.
The resulting Nyquist plot is shown in Figure 5.
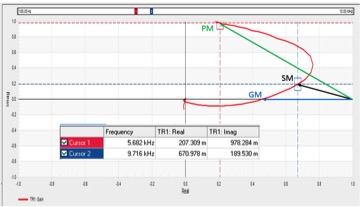
Figure 5 Nyquist chart created from the Bode plot data in Figure 2shows the phase margin, gain margin, and stability margin.
Three points are indicated on the Nyquist chart; phase margin, gain margin and stability margin. The stability margin is defined as the closest distance between the singular unstable point (1,0) and the transfer function. If the curve touches the singular unstable point the circuit will oscillate. The raw data for this chart and a graph showing the distance from (1,0) at each frequency is shown in Figure 6.
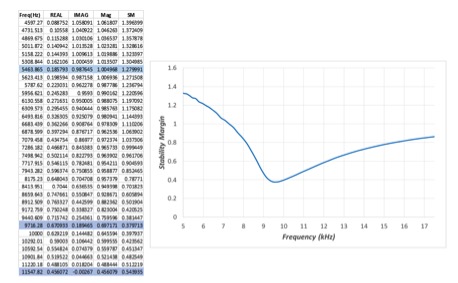
Figure 6 An excerpt of the raw uninterpolated bode plot data with calculations of the gain magnitude and the stability margin or distance from the singular unstable point at (1,0).
Three frequencies are highlighted in the raw data; the phase margin, indicated by the gain magnitude being unity (approximately 5464Hz), the gain margin indicated by the phase being 0 deg (approximately 11,548Hz) and the stability margin, represented by the smallest value of stability margin (approximately 9,716Hz). Looking back at the step load response, the ringing cycle period is seen to be approximately 100us and corresponds with the frequency of the stability margin.
We can calculate the phase margin from the raw data, by first confirming that the gain magnitude at 5464Hz is 1. Using the real and imaginary gain values the magnitude is calculated as:
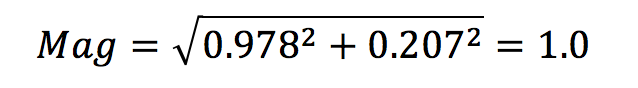
The magnitude being equal to 1.0 confirms that this is the location of the phase margin. The phase margin can then be calculated from the real and imaginary gain terms as:
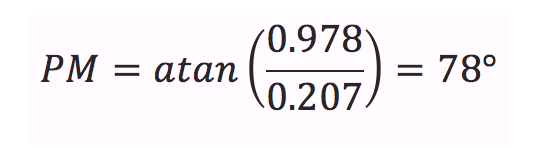
This agrees with the Bode plot cursor measurement. While it may seem contradictory for the Bode plot to indicate good stability while the stability margin is poor, this is a well-known phenomenon. In these cases, the stability margin generated by the Nyquist plot gives the correct assessment, while the Bode plot is in error. [8, 9]
The non-invasive measurement as an alternate assessment method
The stability margin can be computed from the impedance vs. frequency response at the output of the regulator [10, 11]. The output impedance can be measured non-invasively, that is, without impacting the circuit operation. Non-invasive measurements have many advantages. [12]
The unique mathematical solution [13], included in the OMICRON Lab Bode 100 Vector Network Analyzer, transforms the cursor value in real time to an equivalent phase margin value. The impedance waveform, cursor, and stability margin measurement are shown in Figure 6.
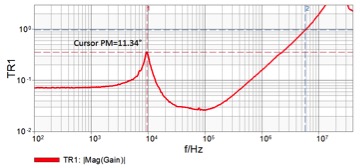
Figure 7 Output impedance measurement and cursor reported stability margin.
In this case, the stability margin is effectively 11.34 degrees. The peak impedance frequency of just under 10kHz and agrees with the ringing frequency seen in the step load response.
The Nyquist plot is a valuable solution in cases where the signal injection and probing is possible, but the control loop is not linear or has many poles and zeros. The non-invasive impedance measurement technique is valid in nearly all cases and is particularly useful in cases where a Bode plot cannot be measured, such as in voltage references and fixed voltage regulators that do not have an available control loop access point.
New measurement probes, being developed by Picotest, will further simplify the non-invasive measurement, especially in cases where physical access is severely limited. The non-invasive method also allows the assessment of multiple loop converters, as well as input filter stability.
The non-invasive method also works well with high bandwidth opamps, where breaking the loop could interfere with the measurement and in hi-reliability applications where it is not possible to cut a trace or wire to break the control loop.
Additional Reading
1. H. W. Bode, Variable equalizers, BSTJ, vol. 17, pp. 229-244, 1938.
2. W. R. Evans, Control System Dynamics, New York, NY: McGraw Hill, 1954.
3. S.M. SandlerFive Things Every Engineer Should Know about Bode Plots, Power Electronics Technology, X, 201X http://www.powerelectronics.com/power-electronics-systems/five-things-every-engineer-should-know-about-bode-plots
4. S.M. SandlerNon-Invasively assess your multiple loop LDO’s Stability ,EDN, X, 201X http://www.electronicdesign.com/power/non-invasively-assess-your-multiple-loop-ldo-s-stability
5. R. D. Middlebrook, Input filter considerations in design and application of switching regulators, Proc. IEEE Industry
6. S.M. Sandler When Bode Plots Fail Us, Power Electronics, April 30, 2012 http://powerelectronics.com/power-electronics-systems/when-bode-plots-fail-us
7. M. Jones, Tale of the Bode Plot Failure, EEWeb.com Jan 29, 2011 http://www.eeweb.com/blog/mike_jones/tale-of-the-bode-plot-failure
8. H. Nyquist, Regeneration theory, BSTJ, vol. 11, pp. 126–147, 1932.
9. N. Nichols, in Theory of Servomechanisms, H. M. James et al., Eds. New York, NY: McGraw-Hill, 1947.
10. S.M. Sandler Assessing POL Regulators Using Non-Invasive Techniques, Power Electronics Technology, October, 2012 http://powerelectronics.com/regulators/assessing-point-load-regulators-using-non-invasive-techniques
11. S.M. Sandler How to verify control loop design, EDN, October 30, 2013 http://www.edn.com/design/pc-board/4423589/How-to-verify-control-loop-design
12. S.M. Sandler Troubleshooting Distributed Power Systems: Using Current Injectors,How2Power.com, Oct. 2013 http://www.how2power.com/newsletters/1310/index.html#Story3
13. S.M. SandlerNew Software Improves Non-Invasive Phase Margin Measurement Accuracy, Power Electronics Technology, X, 2014 http://www.powerelectronics.com/power-electronics-systems/software-enables-accurate-stability-test-improves-non-invasive-phase-margi