
Device and system clocks typically operate at a fixed frequency. This can lead to electromagnetic interference at the clock frequency, resulting in crosstalk and coupling into nearby signal paths. Spread spectrum clocking (SSC) allows for clocked devices to reduce radiated emissions by frequency-modulating the signal. This controlled modulation distributes the energy of the carrier across a wider frequency range, thereby reducing peak power. For this reason, special interest groups overseeing high speed serial data standards currently in use such as PCI Express and Serial ATA, have required that devices must be SSC-capable in order to be compliant.
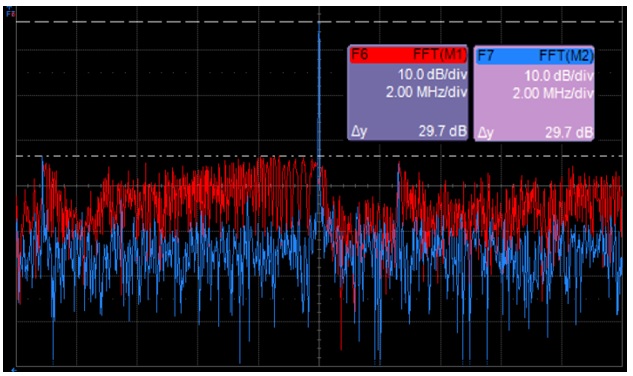
Figure 1 shows the FFT spectrum of a Serial ATA hard drive clock signal with SSC modulation enabled (red) and disabled (blue).
Tracking SSC
Verifying the modulation profile of SSC has historically been challenging because it involves a frequency shift as a function of time. The typical view provided by a spectrum analyzer displays frequency (Hz) on the X-axis, and magnitude (dB) on the Y-axis. This view can verify the range of SSC frequencies, but cannot show the time order in which they occurred. The typical view provided by an oscilloscope displays time on the X-axis and magnitude (V) on the Y-axis. This view can verify waveshape but does not discern the rate of cyclical frequency shifts. What is needed, is a view which displays frequency as a function of time.
Using the Track math operator [link to SI Journal article 4641], oscilloscopes are able to plot a parametric measurement as a function of time. When applied to a modulated signal, the Track function can demodulate the waveform. By tracking the frequency measurement parameter, an oscilloscope can display the SSC modulation profile as a function of frequency versus time.
Shown in Figure 2, a 3 Gb/s Serial ATA Gen 2 waveform (white) is acquired at a sample rate of 40 GS/s with an eight million sample point record. The triangular SSC frequency modulation profile of a Serial ATA signal is displayed as a waveform trace. In addition to providing a qualitative view (the SSC has triangular modulation with sharp peaks and linear transition regions), accurate quantitative measurements can also be performed. Because the Track operator is a waveform, standard oscilloscope measurements can be applied. These standard measurements, however, take on a special meaning when applied to the SSC modulation profile.

Parameter P1 measures the instantaneous frequency of each of the 149,643 data transitions in the waveform. A frequency Track waveform (blue) plots frequency as a function of time, revealing the triangular modulation shape of SSC. In this view, modulation is separated from the carrier and is displayed as an independent waveform. The P2 measurement parameter, applied to the Track, is a direct measurement of SSC modulation frequency. Measurement parameters P3 through P5 measure the clock frequency deviation of SSC, down-spread from the corresponding nominal frequency. P3 and P4 show the highest and lowest instantaneous frequency values, while P5 shows the peak-to-peak frequency deviation. This quantitative analysis allows for rapid determination of compliance and rapid detection of any frequency errors occurring within the SSC.
Qualitative information is also available from the SSC modulation profile shape. In some cases, this information can be as valuable, or even more valuable than the quantitative information. Acquired during an actual debugging session of a Serial ATA Gen 2 device, the green waveform in Figure 3 shows a series of non-linear transitions. These "stair-step" transitions resulted in very large deterministic jitter values during testing, but the cause was unknown. Only after plotting the SSC modulation profile did the designers determine that their jitter problem was due to a faulty digital encoder in the SSC modulation chipset. A qualitative view of the SSC modulation profile made this diagnosis an easy determination. Without a qualitative view of the modulation profile, discovering the root cause of this real-world jitter problem would have been very difficult.

Verifying SSC performance is now possible using parameter tracking capabilities to display a waveform consisting of instantaneous frequency as a function of time. Applying traditional measurement parameters to the Track results in a different type of meaningful measurements, such as SSC frequency and SSC frequency deviation. In additional to quantitative SSC-specific measurements, the qualitative view of the frequency-versus-time modulation profile can identify modulation anomalies and provide insight into the source of SSC modulation errors.