
High speed digital designers live in the time domain. We create signals that are time-domain based, we analyze the signals in the time domain, and we measure performance in the form of eye diagrams in the time domain. After all, the time domain is the real world.
But sometimes, we can get to an answer faster by taking a detour through the frequency domain. The frequency domain is a mathematical construct with very well-defined rules. Some electrical properties, such as impedance, are more simply described in the frequency domain. Some interconnect properties, such as dielectric loss and conductor loss, are also more simply described in the frequency domain.
We transform time domain signals from the time to the frequency domain with Fourier transforms. While this is a nearly complete transform in both directions, the result in the frequency domain can be a complex assortment of frequency components. In such cases, we typically look for a few figures of merit which describe the most important features of complex behaviors.
For a signal in the time domain, an important figure of merit is its rise time. This is typically the 10-90 or 20-80. The shape of the rising edge strongly influences the interpretation of the rise time. To have meaning, we have to make some assumptions. On option is that the edge has a nearly Gaussian shape. Another option to assume is that it is the response of a 1-pole filter. Otherwise, just one term, rise time, has an ambiguous interpretation.
The corresponding figure of merit in the frequency domain is the bandwidth. This is even more ambiguous. The term bandwidth can apply to the interconnect, a measurement, a model, or a signal. In each context, it has a slightly different interpretation.
We define the bandwidth of the signal in the frequency domain as the highest frequency component that is significant. We can ignore all the frequency components above the bandwidth and not lose any valuable information about the time domain response.
Here lies the ambiguity. What does significant mean? This ambiguity means we have to be careful interpreting how we use the terms bandwidth and rise time. If we care about precision and detailed information, we don’t want to use these figures of merit. Instead, we want to deal with all the time domain data and the whole spectrum in our analysis.
Sometimes, an OK answer NOW is better than a good answer late.
Sometimes, we just want a rough measure of what is going on. This is when the figures of merit of rise time and bandwidth are useful metrics to give us a rough feel for the behaviors. In such a case, there are a few approaches for connecting the rise time of a signal in the time domain with its bandwidth in the frequency domain.
For the special case of a signal that is the response to a 1-pole low pass filter, like an RC filter, we can analytically connect the 10-90 rise time with a single metric of bandwidth. Here is how.
Rise time and bandwidth for a 1-pole filter
This analysis applies to the specific case of a signal which is the response of a low pass filter. We take an ideal step edge which has a zero psec rise time. We pass this through a low pass filter defined by a single-pole, RC filter. In this example, I chose a pole at 10 GHz, or an w0 = 2 x pi x 10 Grad/sec. I implemented this filter by selecting the RC = 1/w0.
An example of the 1-pole filter and the step response is shown in Figure 1. The -3 dB point in the transfer function is at 10 GHz, as designed.
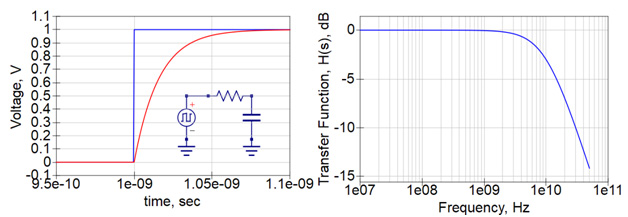
Figure 1. The time domain response from the filter and its transfer function. I shifted the starting time of the edge to show the initial flat part of the signal.
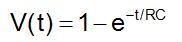
We have a simple analytical expression for the time domain waveform from the filter and can calculate the 10-90 rise time. The voltage coming out of the filter is:
With a little algebra, we can calculate the 10-90 rise time, the time it takes to pass between the 10% point and the 90% point as
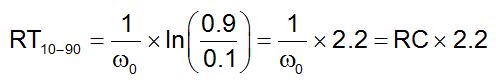
This is the well know approximation that if we have an RC response, the 10-90 rise time is 2.2 x the RC time constant.
What is the bandwidth of the signal in the frequency domain? Here is where we arbitrarily define the bandwidth as the -3 dB point of the filter. This is the frequency at which the signal amplitude through the filter is down to 70% the amplitude of the signal going in. All higher frequencies are attenuated even more.
Is -3 dB really a good figure of merit for the bandwidth of a signal limited by this filter? It depends.
If I am using a 1-pole filter to remove all the signal components above 2.5 GHz to prevent interference with a Bluetooth receiver, and my input signal is 1 V and the pole frequency is 2.5 GHz, I have a problem. I need -100 dB isolation in my filter. I need either a much lower frequency pole filter, or a much higher order filter. Either way, the -3 dB point is not a good figure of merit of the limit to the highest frequency component that is significant.
But if I just want one number as a measure of the frequency components that would have less than 50% the energy contained in the components of the original signal, the -3 dB frequency point might be a good starting place.
The frequency where the filter response is -3 dB down is the pole frequency, w0/(2 x pi). Using this as a figure of merit of the bandwidth of the signal that comes through the filter, the relationship between the rise time and BW is:
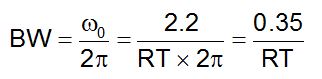
This is the commonly used relationship between the rise time of a signal and its bandwidth.
This says, if we want a rough measure of the highest frequency components in a signal, it is about 0.35 divided by its 10-90 rise time.
The underlying assumption is that the signal is the response of a 1-pole filter and the bandwidth is the -3 dB point of the filter.
It is a rough approximation.
If you are worrying about whether the 0.35 should be 0.5 or 0.45, then don’t use this approximation. If your application is sensitive to harmonic components in your signal that are in the -50 dB range of the first harmonic, don’t use this approximation.
But, if you want a quick estimate of the highest frequency components in a signal, this is a good starting place.
There are other routes to estimate the connection between the bandwidth and rise time in a signal. This is one of them.