I’ve been making this controversial statement since I presented Killing the Bode Plot at DesignCon 2016. To be clear, I’m not saying control loop stability isn’t important, of course it is. I am saying that whether your focus is power supply design, power integrity or mixed-signal, the Bode plot probably isn’t going to provide you with a reliable or optimum solution. There are five major reasons for saying this.
Lack of access
The first, and most obvious, reason is that in many cases we can’t measure a Bode plot because we can’t access it. Some examples include LDO regulators, voltage references and power modules. These devices only provide input, output and ground pins. Power supply controllers typically include an internal voltage reference and in this case only the output and the ground are accessible.
Many engineers have the misconception that if the control loop isn’t accessible than we don’t have to be concerned about stability or at least we don’t need to measure it. How are engineers evaluating the control loop stability of these devices?
Frequency limitations
There are two frequency limitations in measuring Bode plots. One is that most frequency response amplifiers (FRAs) are limited in bandwidth to below 50 MHz. Some devices exceed this limit and the trend of higher control loop bandwidth exacerbates this. Picotest has already demonstrated voltage regulators with 500 MHz bandwidth, but the bandwidth of many ADC buffers, high-speed amplifiers and even the new Picotest J2113A semi-float amplifier are well above 500 MHz, making the Bode plot an unsuitable method of assessment.
Even if the FRA frequency range wasn’t a limit, the ability to inject a quality signal at these frequencies is a fundamental problem. While the Picotest J2110A solid state signal injector offers DC-100MHz flat response, getting the signal from the injector to the board being tested isn’t trivial above a few MHz.
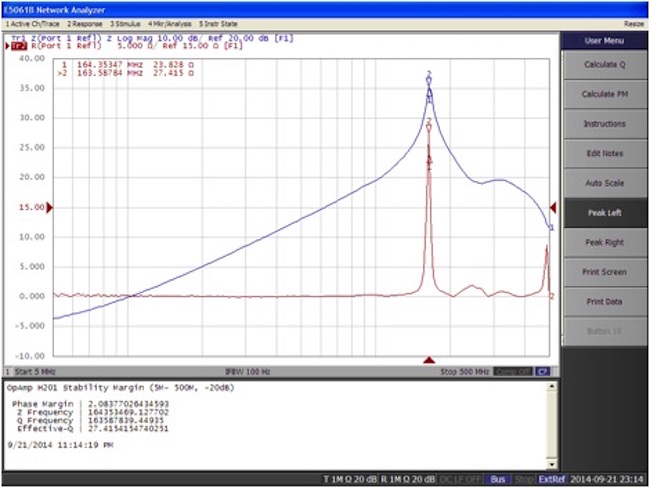
Figure 1 This high-speed opamp has very poor stability with a 2-degree phase margin. It would be very difficult to inject a signal up to 500MHz. In this case, the system is the cause of the stability issue—PCB capacitance via PCB and pin capacitance of connecting devices. (This data was collected using the non-invasive stability tool on the Picotest E5061B. The blue plot is impedance and the red plot is an interim result related to group delay)
Higher order or non-linear control systems
Another limitation is that many devices or systems have highly non-linear performance. The LDO and the voltage reference are examples of devices that have control loops with a large dependency on load current. Another example is the DDR termination regulator which has an even more dramatic load current dependency. Other voltage regulators, such as the Texas Instrument TPS7H1101 use multiple, nested feedback loops, with only one available to the outside world. I addressed this voltage regulator in an article titled Non-Invasively Assess Your Multiple-Loop LDO’s Stability a few years ago.
Higher current voltage regulators for CPU applications from companies, like Intersil, for example, use non-linear control schemes such as ripple based hysteretic control and/or digital control. In particular, non-linear digital control is used to allow fine tuning of the transient response for these demanding applications.
Severely impacted by the system
And yet another reason is that in many applications the performance of the operating circuit is strongly related to the system. A high-powered voltage regulator for a CPU, for example, includes very large amounts of decoupling capacitance to meet the target impedance at the high-powered chip. This capacitance can be up to 10’s of milliFarads. The PCB resistance and inductance, along with this distributed capacitance, can have a significant impact on the control loop performance, especially since many of these applications employ remote voltage sensing. This effect was brilliantly addressed in a DesignCon 2015 paper titled Impact of Regulator Sense-point Location on PDN Response , presented by Oracle. The opamp in Figure 1 is also a good example of system level interaction.
Limited interpretation
Finally, phase and gain margins do not provide a relative measure of stability. There have been documented stability assessment methods dating back to the late 1800s (Routh and Routh-Hurwitz). Several stability methods were introduced in the mid 1940s. These include the Bode plot, the Nyquist plot and the Nichols chart to name a few. The Bode plot has been the most popular because it is simple to interpret, using straight lines and asymptotic approaches. Bode correctly stated that simultaneous phase margin and gain margin assure stability. They do not indicate a measure of relative stability, meaning that it’s possible for a control loop that has both better phase margin and gain margin to be less stable than one with lower phase and gain margins. Many authors have published articles on this subject, including Tale of the Bode Plot Failure from Michael Jones and my own When Bode Plots Fail Us. The example in Figure 2 shows a DC-DC converter with good gain margin and phase margin, but poor stability margin.
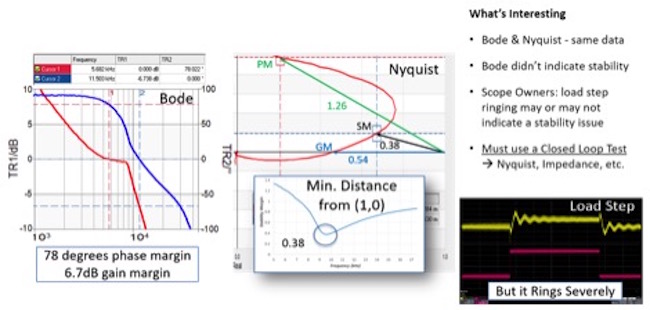
Figure 2 This slide from the DesignCon 2016 Killing the Bode Plot presentations shows a case where the Bode plot is acceptable with 78-degree phase margin and almost 7dB gain margin but a stability margin of 0.38 (approximately 20 degree phase margin equivalent). Despite the adequate margins, the step load indicates excessive ringing.
The limitations of the Bode plot are discussed extensively in one of my favorite control systems books, Feedback Systems, which is now out of print, but available as a free download. This book also discusses many other stability topics that are becoming more relevant today, including stability margin and time delay margin. An example of time delay margin is shown in Figure 3.
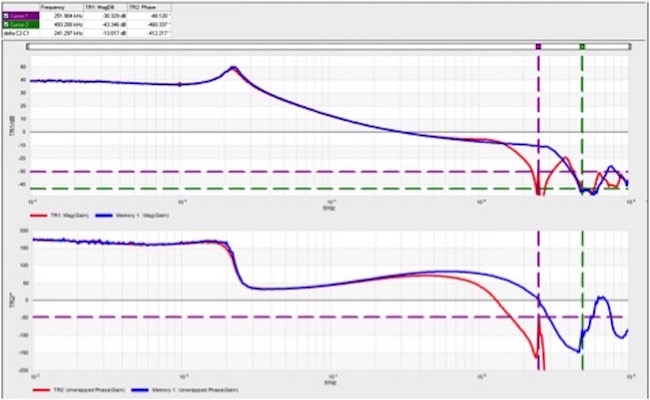
Figure 3 These Bode plots from a PMBus DC-DC converter show how the phase margin is degraded by changing the switching frequency, degrading the time delay margin. Blue is 500kHz and red is 250kHz switching.
Considering Stability
Perhaps the problem is really that we are looking at the wrong end of the equation. We are concerned about stability, but not because of the margins, but because of how it relates to closed loop performance. Control loops are used to provide improved closed loop performance, and will do so when designed properly and will degrade performance when not designed properly. If the goal of the control loop is to assure the desired closed loop performance, then I might argue that it’s a better use of our time to manage the closed loop performance and not the open loop performance. I would also argue we need to do this from a system level, given that the system often has a large impact and that we need to assess the performance whether access is available for a Bode plot or not. This is illustrated in Figure 4.
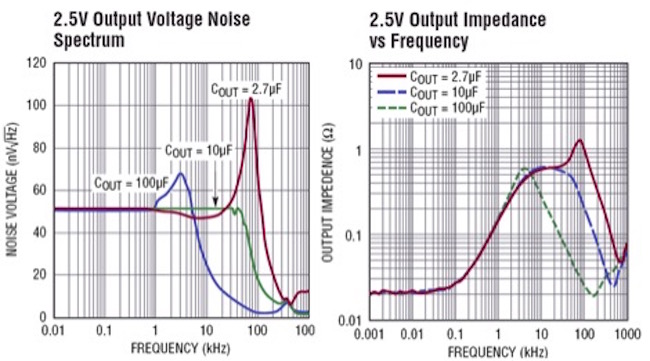
Figure 4 This manufacturer’s data for a voltage reference shows the impedance and the noise with different output capacitors. The peaks in impedance and noise density are both due to poor stability. Our goal is to achieve optimum noise density and so maybe it is better to focus on improving the noise, which by default requires improving the stability.
Considering the high-power CPU voltage regulator again, the goal is generally to have a flat impedance response, close to the target impedance. The flat impedance, by definition, is stable and is the end-goal, so direct asseement of the impedance is a more direct, and always accessible, solution. It’s questionable whether this small signal impedance holds up under large signal performance, and the Bode plot is also a small signal measurement. In many cases it does, and this is generally verified using a VR Tool Tester to create a high current transient or to measure large signal impedance. The closed loop assessment includes all stability margins, including the time delay stability. Since the closed loop measurements are measured using S parameters in an RF Vector Network analyzer, the measurements don’t require unmatched injection and can be made well into the GHz frequency range. Some VNAs, like the Omicron Lab Bode 100, offer many stability measurement options. The Bode 100 can measure Bode plots, Nyquist charts and S-parameter closed loop impedance. The Keysight E5061B also provides these measurement options.
Conclusion
I still care about stability as much as ever. I’ve just determined that in many cases we can’t acquire Bode plots, and, even if we do, they can be misleading. I’ve also discovered that it’s often faster and easier to focus on closed loop performance as the target rather than phase margin and gain margin as the target. This generally results in a more optimum circuit design and with a shorter design cycle time. It is also possible to overachieve stability as I discussed in my EDICON 2017 paper Designing Power for Sensitive Circuits. Overdesign results in added cost without a performance benefit and in today’s world that just isn’t good enough. We need shorter design cycles, with better performance at lower cost and that means optimizing the closed loop target. Stability is one quantifiable metric and in some cases a Bode plot is a reasonable test to perform. In most cases it is a means to achieving a goal and not the goal itself.