
Measurement of Pulse Amplitude and Duration
This method uses an oscilloscope, whereas the pulse is sampled with high time resolution. The method is most suitable for pulse-modulated RF generators. The spectrum amplitude is calculated from the area of the pulse [V·s]. The ideal measurement equation can be written as follows

where Urms is the un-modulated CW signal level, T is the modulation pulse duration and kcor is a correction factor taking into account the signal level change after switching ON the pulse. The pulse repetition rate should be stable and correction factor should not change with CW frequency. An example of the pulse modulated CW signal acquired using a real-time oscilloscope is shown in Figure 10.
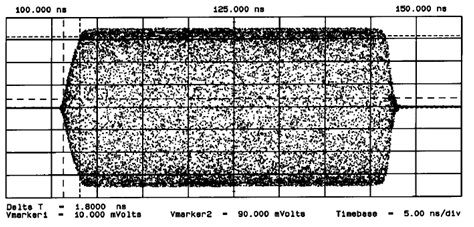
Figure 10. Measurement of pulse amplitude and duration, pulse-modulated RF generator.
The method is also applicable for baseband pulse generators. The pulse shape must be very close to rectangular, which is not always true for the measured IGUU2916 generator (especially band C/D). The pulse amplitude and duration is measured using an oscilloscope. The pulse shape in the time domain is generally distorted by the transfer function of the cable + attenuator(s) and the oscilloscope transfer function. In order to remove this effect correctly, one has to perform a deconvolution of the transfer function in the frequency domain.
The pulse shape, however, was acquired using a short oscilloscope epoch (only the pulse visible on the screen), which makes the frequency resolution very coarse and the correction is not easily applicable.
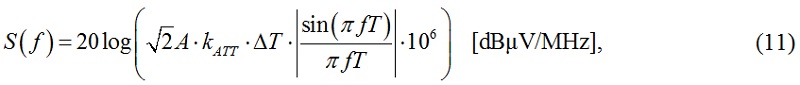
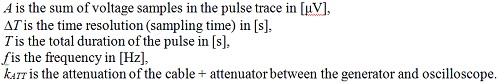
where
Example of the IGUU2916 pulse shape in different bands is shown in Figure 11 for changing the pulse repetition rate.
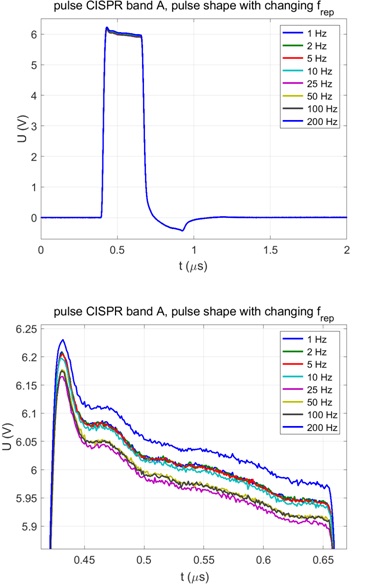
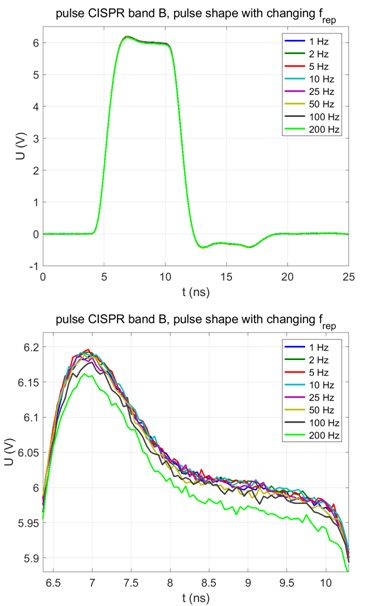
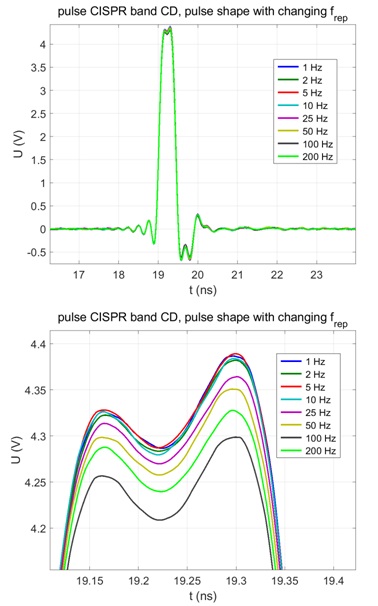
Figure 11. Pulse shape for bands A/B/C/D of the IGUU2916 Main generator with changing pulse repetition rate, detail of the pulse maximum on the right (amplitude without correction for the cable and attenuators).
The measured relative pulse frequency stability of the IGUU 2916 main generator in particular bands is better than ±2´10-4. The IGUU 2916 uses a 4 MHz crystal oscillator and a multi-stage frequency divider, which results in a very good approximation of the exact division ratio. Deviation of pulse frequency causes deviation of amplitude via the pulse response curve.
It can be seen from Figure 11 that the pulse shape in bands A and B is close to rectangular and the calculation results are comparable to other methods. The pulse shape in band C/D, however, is distorted and moreover, it contains more noise than in case of the pulses in bands A and B.
The results shown below are only informative and they do not correspond very well with the results of the Fourier transform method or the IF pulse measurement method. The pulse shape (measured in the time domain) must be corrected for the attenuation of the cable + attenuator(s) between the generator and the oscilloscope and also for the frequency response of the oscilloscope.
The pulse shape trace was acquired only for a small number of points, thus there is not enough data for performing the correct deconvolution and the correction was only done approximately. From Figure 11 also certain overshoot and undershoot is obvious. The measurement uncertainty mainly comprises of the cable + attenuator correction, impedance mismatch and type A uncertainty. It is obvious that this method is better suitable for pulse-modulated RF generators and not the base-band pulse generators like IGUU 2916.
Calculated results (values in bold red deviate significantly from results of other methods):
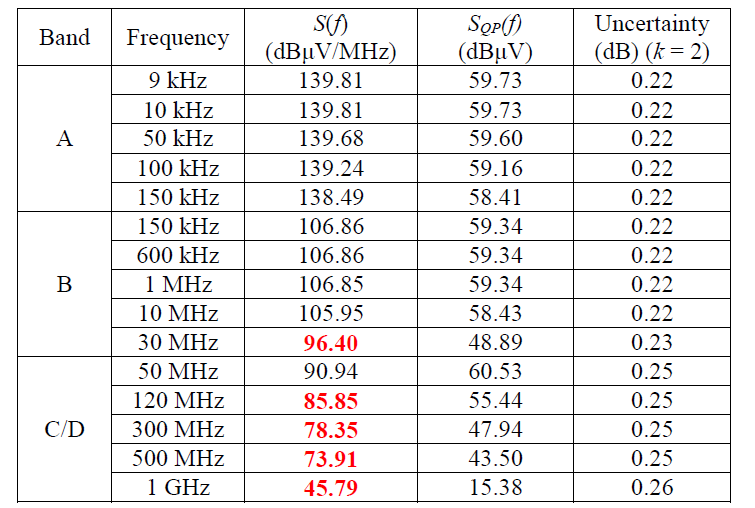
Table 9. Example of measured results, IGUU 2916 Main generator, amplitude setting 60 dBμV.
Measurement of one spectrum line amplitude
The principle of this method is a comparison of one spectrum line of the pulse signal with a known CW signal spectrum (equal frequency). This method assumes the generator pulse repetition frequency is high enough so that only one spectral line falls within the EMI receiver filter bandwidth: see Figure 12. The nominal filter bandwidths for the 6 dB amplitude drop are 200 Hz (band A), 9 kHz (band B) and 120 kHz (band C/D), respectively. This method is referred to as “harmonic measurement” in [1].
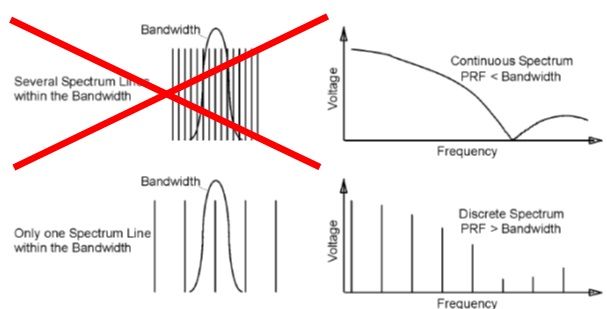
Figure 12. Measurement of one spectrum line amplitude.
The spectrum amplitude is then calculated using a simple formula
where A is the substitution CW signal level for the same reading of the receiver and frep is the generator pulse repetition frequency. A calibrated measuring receiver is needed in this case. The measurement setup is shown in Figure 13. The receiver filter should be well symmetrical.
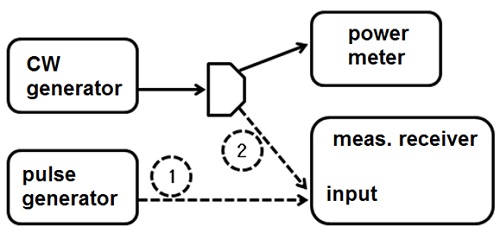
Figure 13. Measurement setup for the measurement of one spectrum line amplitude.
The maximum pulse repetition rate of the IGUU2916 main generator is 200 Hz, thus only the band A could be possible to verify. In other bands, the Aux generator must be used (max. amplitude 40 dBμV and max. repetition rate 20 kHz). The pulse shape must not change significantly with the pulse repetition frequency, which is not fully true (see Figure 14, Aux generator). Note the slightly different pulse shapes in particular CISPR bands of the IGUU2916 Main and Aux generator in Figure 11 and Figure 14, respectively, due to the different principle (charged transmission line and a mechanical switch versus an electronic generator with solid-state semiconductor switch).
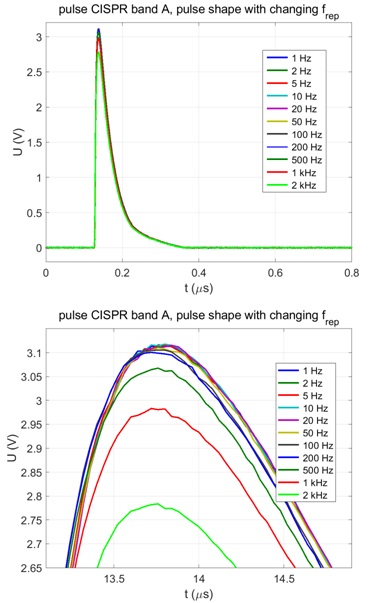
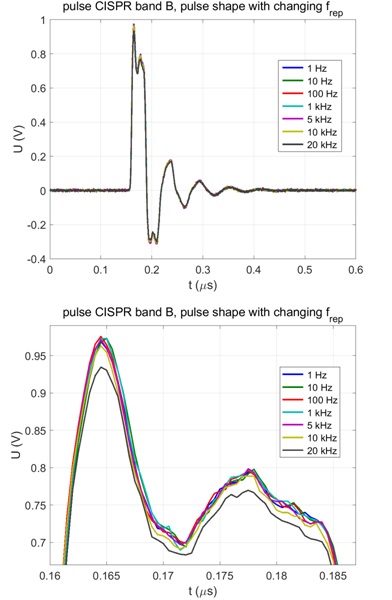
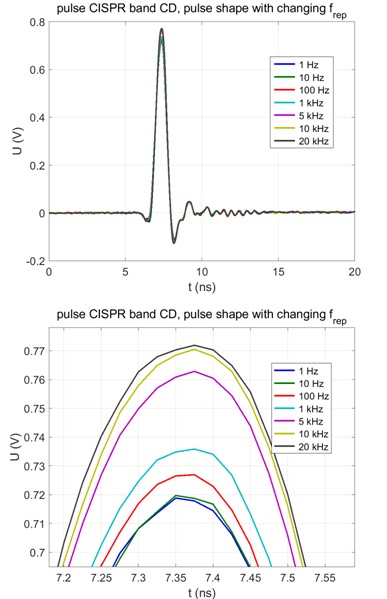
Figure 14. Pulse shape for bands A/B/C/D of the IGUU2916 Aux generator with changing pulse repetition rate, detail of the pulse maximum on the right (amplitude without correction for the cable and attenuators).
The specified stability of the pulse repetition frequency of the IGUU 2916 auxiliary generator in particular bands is better ±2´10-4 for 0 Hz to 200 Hz, better than ±2´10-3 for 0-2 kHz, and ±1.5 % for 0 Hz to 20 kHz.
This method was evaluated for the IGUU 2916 Aux generator only (bands A, B) and then compared with the results obtained using the other methods. The band A receiver nominal filter bandwidth is 200 Hz, the pulse repetition frequency of 500 Hz was selected for evaluation (pulse shape does not change significantly, see Figure 14). The band B receiver nominal filter bandwidth is 9 kHz and the pulse repetition frequency of 15 kHz was chosen (pulse shape still not significantly changed).
For band C/D, the generator repetition frequency must be at least 120 kHz in order to measure only 1 spectrum line within the EMI receiver filter bandwidth (maximum repetition frequency settings of the IGUU 2916 Aux generator is 20 kHz). The final results are shown in Table 10. Note that the maximum IGUU 2916 Aux generator amplitude settings is 40 dBμV, whereas the maximum amplitude settings of the IGUU 2916 Main generator is 60 dBμV.
As a verification of the method, the spectrum amplitude of the Aux generator with 40 dBμV was also evaluated using the Fourier transform method (the measurement uncertainty is higher at low frequencies than for the Main generator and amplitude setting 60 dBμV, see Table 5, due to higher type A uncertainty of the calculated spectra). The average spectrum amplitude evaluated from 20 measurements using the Fourier transform method is shown in Figure 15. The repeatability of Aux generator pulses is worse than the repeatability of the main generator pulses.
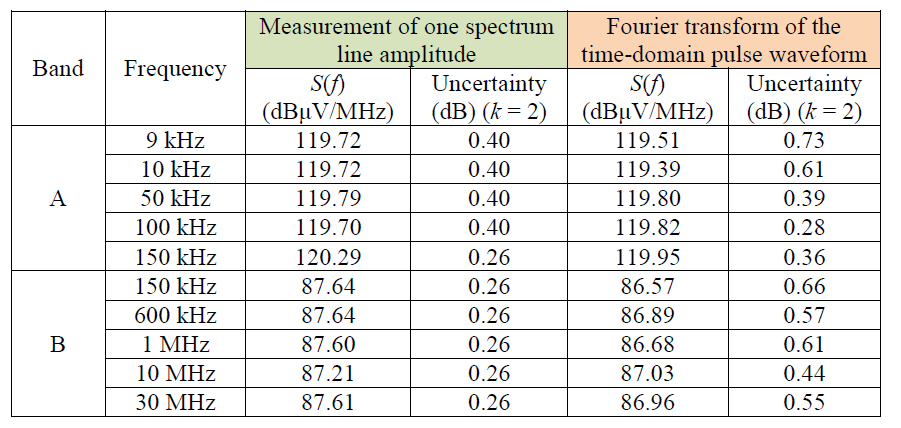
Table 10. Example of measured results, IGUU 2916 Aux generator (amplitude setting 40 dBμV).
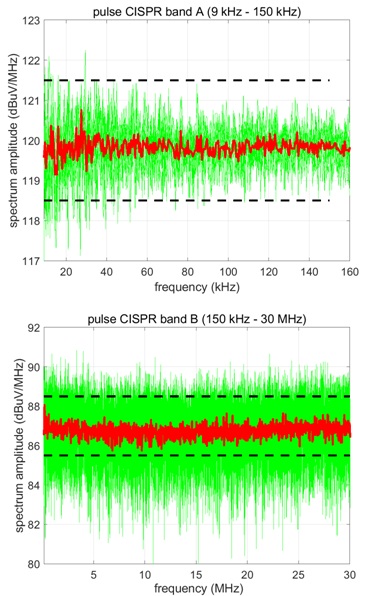
Figure 15. Average spectrum amplitude (red) calculated from 20 measurements (green), IGUU 2916, Aux. generator. The dashed horizontal lines denote the ±1.5 dB spectrum uniformity limit.
In this paper, various methods for calibration of pulse generators are discussed, and the results of measurement of the spectrum amplitude of a particular pulse generator Schwarzbeck IGUU 2916 are presented. The spectrum amplitude was evaluated using the following methods: a) Fourier transform of the time-domain pulse waveform, b) IF measurement method, c) measurement of pulse amplitude and duration and d) measurement of one spectrum line amplitude.
The method a) can achieve the lowest measurement uncertainty and is simple to perform. It requires a fast digital real-time or sampling oscilloscope, and the spectrum of the measured waveform must be corrected for known attenuation of the signal path. The method b) uses an EMI receiver which is more common in calibration laboratories. The measurement uncertainty is comparable to method a).
One has to be careful and not to overload the receiver input, as time-domain pulse generators use high peak amplitudes that may destroy the input mixer. Method c) is more suitable for pulse-modulated RF generators, and the results for a base-band pulse generator IGUU 2916 band C/D are not reliable due to distorted pulse shape. The measurement uncertainty is slightly higher than that of methods a), b). Method d) is applicable only for pulse generators with very high pulse repetition rates (at least 500 Hz for band A, at least 10 kHz for band B and at least 120 kHz for band C/D). The results achieved for band A and B of the IGUU 2916 Aux generator are comparable to method a) for the same generator, however, the measurement uncertainty is rather high due to noise and low repeatability of the pulses. The goal uncertainty of maximum ±0.5 dB given in standards could not be achieved using method d). The measured results with measurement uncertainties are summarized in Table 11.
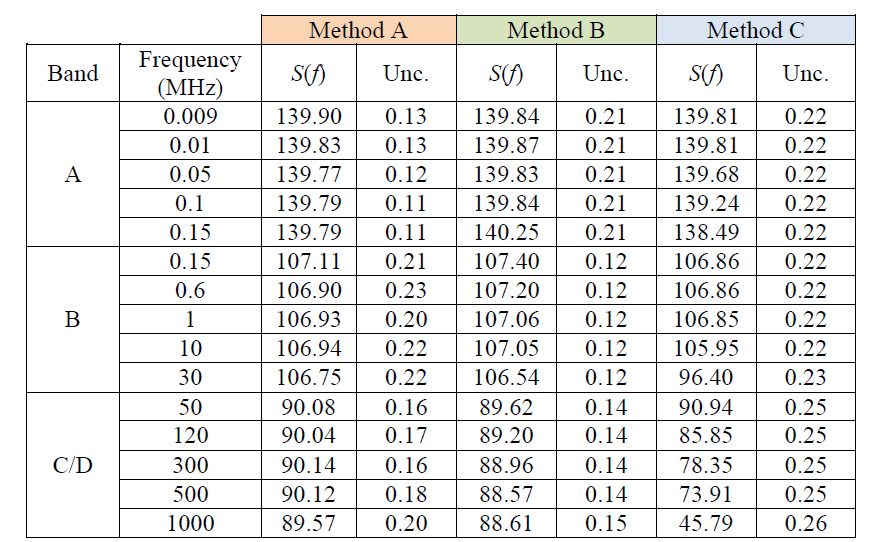
Method A = Fourier transform of the time-domain pulse waveform
Method B = Intermediate-frequency measurement method
Method C = Measurement of pulse amplitude and duration
Acknowledgement
This work was supported by the project 15RPT01 RFMicrowave. This project has received funding from the EMPIR programme co-financed by the Participating States and from the European Union’s Horizon 2020 research and innovation programme.
References
[1] Specification for radio disturbance and immunity measuring apparatus and methods – Part 1-1: Radio disturbance and immunity measuring apparatus – Measuring apparatus. EN 55016-1-1 ed. 3 standard, 2014.
[2] CISPR 16-1-1 Ed. 4: Specification for radio disturbance and immunity measuring apparatus and methods – Part 1-1: Radio disturbance and immunity measuring apparatus – Measuring apparatus, International Electrotechnical Commission, IEC, 2015.
[3] Andrews, J. R.; Arthur, M. G.: Spectrum Amplitude – Definition, Generation and Measurement; National Bureau of Standards; 1977
[4] IEEE Standard for the Measurement of Impulse Strength and Impulse Bandwidth; IEEE Std. 376-1975 (inactive – withdrawn)
[5] EA-4/02 Expression of the Uncertainty of Measurement in Calibration, European Co-operation for Accreditation, 1999
[6] PVF BKIT 1, Load Resistors for EFT/Burst Verification, EM Test. [online] Available: http://www.emtest.com/products/product/135120100000013765.pdf
[7] MIL-STD-462, Military Standard: Measurement of Electromagnetic Interference Characteristics, 1967.
[8] Instruction Manual for VLF/HF/VHF/UHF Calibration Pulse and Sine Wave Generator IGUU 2916, Schwarzbeck Mess Elektronik, Rev. B [online]. Available: http://schwarzbeck.de/Datenblatt/m2916.pdf