
In power distribution networks (PDN), capacitors are used in the largest number. Further away from the DC source, they provide the local charge storage. We have to use enough capacitors so that the PDN functions properly. At the same time, to keep cost and size in check, we want to avoid overdesign and not use capacitors unnecessarily.
Real-life capacitors always have parasitic resistance and inductance, commonly called as effective series resistance (ESR) and effective series inductance (ESL). While ESR and ESL values are not guaranteed for most capacitors, capacitance is a guaranteed number. After all, we purchase a capacitor for its capacitance.Surprisingly, however, many modern high-density ceramic multilayer capacitor (MLCC) has a huge variance of their capacitance values.
Ceramic capacitors achieve their high density in two ways: by using ceramic composite materials with higher dielectric constants, and by using thinner dielectric layers so that more capacitor plates can be packed into the same body. A common set of ceramic materials used for high-density MLCCs is called Class 2 [1]. Unfortunately, when we use very thin layers of Class 2 ceramics, their dielectric constant will depend on several parameters and therefore the actual capacitance we get will depend on the DC and AC voltages across the capacitor as well as they also may show strong temperature dependence [2].
As an actual example, let us look at one of the capacitors that was extensively documented in [2], where 1uF 0603-size 16V capacitors were tested from various vendors. We further assume that we want to use the part on a 12V supply rail, where the AC noise is low (this will be important later when we take the AC bias dependence into account). Some of the samples were chosen with X5R, some with X7R temperature characteristics. As [2] showed with actual test data, X7R capacitors sometimes have worse DC bias sensitivity than X5R parts.
If we take the part from Vendor B (labeled B7) on Figure 1, we see that at 12V DC bias we can lose 60% or 70% of the capacitance, dependent on which way the DC bias changes.
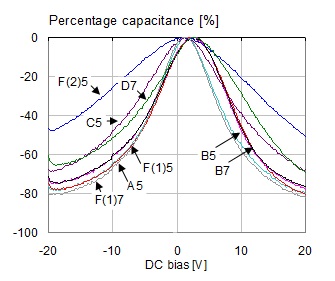
Figure 1: Percentage capacitance as a function of DC bias for all studied 1uF 0603 16V models, measured at 100 Hz and 10 mV AC bias.
When we need to consider the worst-case capacitance loss, we have to consider the cumulative effect of all of the following factors:
- Initial tolerance
- Temperature effect
- DC bias effect
- AC bias effect
- Aging
The sample had +-10% initial tolerance. The X7R temperature characteristics comes with an additional +-15% tolerance window for the temperature variation.
When the part is used with low AC excitation across the part, the capacitance may be up to 20-30% less than what the standard test procedure provides. Since the vendors use standard test methods, the AC bias dependence has only a negative range: 0 … -20%, sometimes up to -30%.
The aging in ceramic capacitors creates an exponential decay with a fixed percentage drop of capacitance for every decade of passed time. In case we take -2.5% per decade drop for X7R parts [3] and assume that the initial capacitance is measured 24 hours after manufacturing, within an expected life span of three years (26208 hours) this means approximately three decades of time, resulting in a -7.5% capacitance drop. If we consider the worst-case cumulative effect of all of the above contributors, we need to multiply all of the ratios corresponding to these percentage values. In the table below, we repeat the list of contributors together with their worst-case limits for the example part.
|
|
Percentage range [%] |
Relative multiplier |
|
Initial tolerance |
+-10 |
0.9 … 1.1 |
|
Temperature effect |
+-15 |
0.85 … 1.15 |
|
DC bias effect |
+0 -70 |
0.3 … 1 |
|
AC bias effect |
+0 -30 |
0.7 … 1 |
|
Aging (over 3 years) |
+0 -7.5 |
0.925 … 1 |
When we multiply the worst-case contributors, we get 0.9*0.85*0.3*0.7*0.925 = 0.15, which means instead of 1uF we have only 0.15uF capacitance. From the table we also see that with modern high density ceramic capacitors the biggest possible capacitance drop is due to the DC and AC bias effects.
Figure 2 shows the DC bias effect measured with a home-made vector-network analyzer on a 100 uF MLCC.
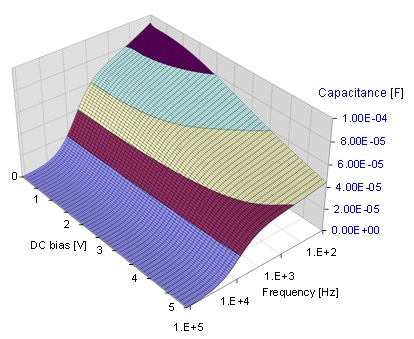
Figure 2: Capacitance as a function of frequency and DC bias. Measured on a 100 uF 4V Class 2 MLCC part.
The 3D surface is put together from multiple individual frequency sweeps, each with a different DC bias value across the capacitor. The DC bias voltage is shown on the left axis; the right axis shows frequency. Note that the capacitance depends not only on the bias voltage, but also on frequency. None of these dependencies are present in Class 1 ceramic capacitors. Figure 3 shows the bias-dependence surface for a 0.1 uF COG MLCC.
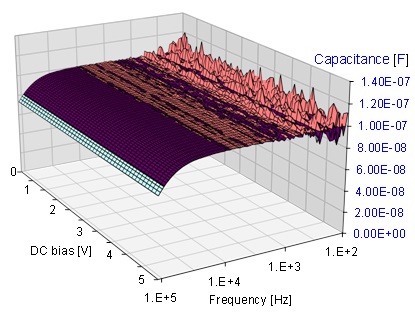
Figure 3: Capacitance as a function of frequency and DC bias. Measured on a 0. 1 uF Class 1 MLCC part.
The 3D surface of Figure 3 is flat in both directions until we start approaching the series resonance frequency of the part. There is an increasing noise on the measured surface at very low frequencies. At 100 Hz the impedance magnitude of a 0.1 uF capacitor is more than 10 kOhm. The noise illustrates the limitation of the simple home-made instrumentation when we try to measure kilo-ohm impedance values in two-port shunt-through connection.
The loss of capacitance can be problematic in different ways. The change of capacitance creates a shift in the series resonant frequency (SRF) of the part. In PDN design methodologies, where the required impedance profile is synthesized from the series resonance frequencies of different capacitors, unexpected change of SRF will result in impedance profiles that may miss the target. The change in capacitance also alters the parallel resonance of different capacitors. If the parallel resonance exhibits high Q, it comes with a proportional multiplication of current circulating in the loop [3]. This can be a problem when we count on our capacitors to handle a given amount of ripple current, for instance at the input of DC-DC converters.
So be careful when you use a 6.3V rated Class 2 ceramic capacitor in a 5V application: a big percentage of the capacitance may be gone. The good news is that this bias dependence is hardly present in tantalum and aluminum capacitors, film capacitors and printed-circuit laminates.
To get more details on the subject, you can read [4] and [5].
References
[1] http://en.wikipedia.org/wiki/Ceramic_capacitor#Class_2_ceramic_capacitors
[2] “DC and AC Bias Dependence of Capacitors Including Temperature Dependence,” DesignCon East 2011, September 27, 2011, Boston, MA. Available at http://www.electrical-integrity.com/Paper_download_files/DCE11_200.pdf
[3] “Electrical and Thermal Consequences of Non-flat Impedance Profiles,” DesignCon 2016, January 19 - 21, 2016, Santa Clara, CA. Available at http://www.electrical-integrity.com/Paper_download_files/DC16_Paper_ElectricalAndThermalConsequencesOf_Choi.pdf
[4] “DC Bias Effect in Ceramic Capacitors” Quietpower column, available at http://www.electrical-integrity.com/Quietpower_files/Quietpower-32.pdf
[5] “Dynamic Models for Passive Components,” Quietpower column, available at http://www.electrical-integrity.com/Qui
Recent Comments
Steve - nice blog. As you and I...
Hi Anto, Thanks for your questions. Regarding 1): this was...
Dear Dr. Istvan, This is an interesting result, but 1)...
Yes, any sharp corner is subject to the...
Very interesting! It should also relate to the 90-degree...