

We have a choice to make. There are two types of measurement acquisition in spectrum analyzers: swept and real-time. Swept analyzers are very similar to classic oscilloscopes in that the frequency span is “swept” between the start and stop frequencies, then analyzed and displayed in a series of events (sweep – analyze/measure – display), so there is some deadtime between sweeps while the system is measuring, processing the data, and displaying the results. This delay can miss some pulsating or intermittent frequency captures.
Real-time acquisition, on the other hand, captures and displays the frequency information at such a rapid process that it appears as if the display is showing captured data in “real time.” This fast acquisition depends on extremely fast A/D conversion, simultaneous fast Fourier transform (FFT) processing, and powerful computer processors. Some of the higher-priced real-time analyzers can generally capture impulsive RF events down to nearly 1 µs (with 100% probability of intercept (POI)) and are very useful for displaying intermittent interference or digital modulations and their characteristics.
A real-time spectrum analyzer has the ability to capture brief intermittent signals and are perfect for capturing modulated wireless or digital signals, as well as general EMI troubleshooting. For example, within the 2.4 GHz industrial, scientific, and medical (ISM) frequency band, you’ll see the entire spread spectrum Wi-Fi signal, as well as the frequency-hopped Bluetooth signals very clearly. You can even observe multiple Wi-Fi access points on the same channel. This isn’t possible with normal swept-frequency spectrum analyzers. They also commonly include “waterfall” displays of frequency and amplitude versus time – a very powerful troubleshooting tool for intermittent EMI issues.
USB-Controlled Real-Time Analyzers
Low-cost USB-controlled examples include the Tektronix RSA306B or Signal Hound BB60C, with the enhanced BB60D soon to be available. Both offer feature-rich PC software. Signal Hound provides their "Spike" software as a free download and regularly updates the functionality. Tektronix offers their SignalVu or EMCVu software packages at a nominal cost. The EMCVu option offers a full pre-compliance package for radiated and conducted emissions, which I use and highly recommend. Either model should fit nicely into the EMC troubleshooting transit case, as both are relatively small.
Signal Hound BB60C real-time 6 GHz spectrum analyzer
The Signal Hound BB60C real-time spectrum analyzer can tune from 9 kHz to 6 GHz and has a dynamic range of +10 to approximately -158 dBm (DANL), which is dependent on resolution bandwidth (RBW). It can easily fit within a standard briefcase with room left over for a medium sized laptop (see Figures 1 and 2).
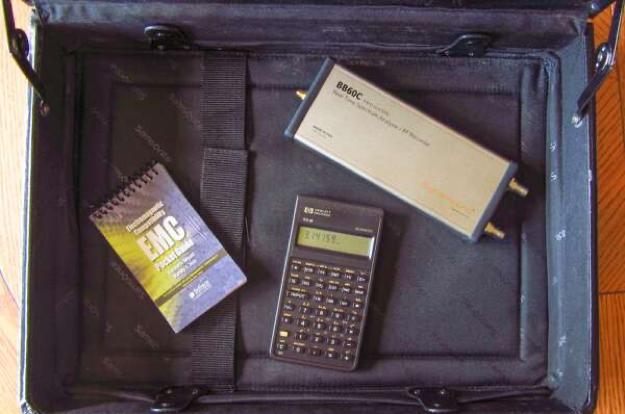
Figure 1. The Signal Hound BB60C USB-controlled real-time spectrum analyzer; it fits easily into a standard briefcase. Cost is $2,879.
The real-time BB60C can display near instant frequency information in up to a 27 MHz instantaneous bandwidth (IBW). The response is so quick, it can trap and display intermittent signals with pulse width as narrow as 4 µs, with 1 µs pulses only attenuated by 2-3 dB. The I/Q data stream is sent through the USB 3.0 port and data streams between 250 kHz to 27 MHz of amplitude-corrected bandwidth may be viewed. The sweep speed is 24 GHz/sec with 1.2 million FFTs per second.
Because much of the signal processing is performed within the PC, you’ll need a pretty powerful computer. In fact, the recommended setup would be a PC running Windows 10, or higher, with an Intel i7, 3rd generation or later with a quad core processor, 8 GB RAM, one USB 3.0 port, a spare adjacent USB 2.0 or 3.0 port, and OpenGL 3.0 capable graphics processor, or equivalent.

Figure 2. The analyzer, supplied CD-ROM, and connecting cable are included.
Controls
The front panel includes a 50-Ω SMA RF port. The maximum power tolerance is +20 dBm. A READY/BUSY light flashes each time a command from the PC is processed. The rear panel includes the USB3.0 interface port, along with a 10 MHz reference input/output and a 1pps trigger/sync input.
Launching the software brings up the spectral display with graphical user interface (GUI) controls on either side. The left-hand panel controls up to six traces with user selectable colors. Trace Type includes settings for clear & write, max hold, min hold, min/max hold, average (10 samples) and average (100 samples). You can also export the current display to memory.
Marker controls include peak search, to center, peak left, peak right, to ref, and delta. Manual positioning of the marker may be done by clicking on the displayed spectrum and then using the left/right arrows to fine tune the position. Depending on the span setting, the marker step size maybe a little too small. This panel also includes a ref offset control and channel power measurement setup.
The right-hand panel includes the frequency settings: span, center, start, stop, and step. The step control is nice if you want to step the frequency over fixed harmonically related frequencies, for example. There are also pushbuttons for going to full span (9 kHz to 6 GHz) or zero span that will allow you to demodulate specific frequencies. This is also where you’d control the amplitude features, like reference level, units (dBm, dBmV, dBµV, mV), dB/Div, gain, and atten.
As a quick check, I compared the spectral profile of a sample embedded processor board between my Rigol DSA815 and the Signal Hound BB60C. I scanned around with the probe to find the largest average emission profile and then left it there during the comparison measurements (see Figures 3 and 4).
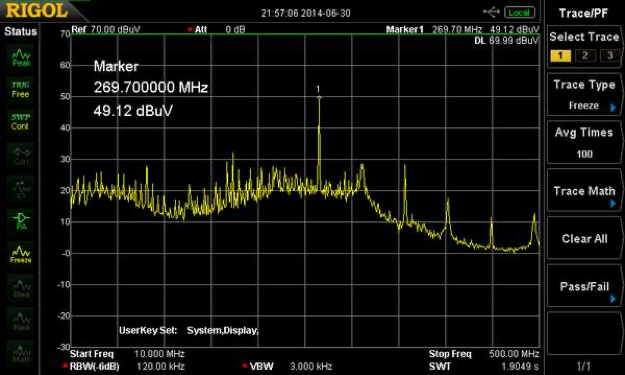
Figure 3. The emission profile of the STM32-F4 Controller as measured with the Rigol DSA815 swept-frequency analyzer.

Figure 4. The emission profile of the STM32-F4 Controller as measured with the Signal Hound BB60C real-time analyzer.
As you can see, we get virtually the same spectral profile. The major harmonic peak is at 270 MHz. With persistence turned on, the Signal Hound reveals a lot more activity around the central portion of the frequency scan not captured by the swept analyzer.
Next, I took a look at some Wi-Fi and Bluetooth packet activity. Because both Wi-Fi and Bluetooth share the same 2.4 to 2.5 GHz spectrum, the latest version of Bluetooth uses a protocol called Adaptive Frequency Hopping (AFH). Basically, the Bluetooth transmitter first looks for potential interfering Wi-Fi signals and then avoids that section of spectrum as it enables its frequency hopping. This effect can be observed in Figure 5. The Wi-Fi signal is on channel 1 (2412 MHz), while the Bluetooth frequency hopping may be seen just to the right.
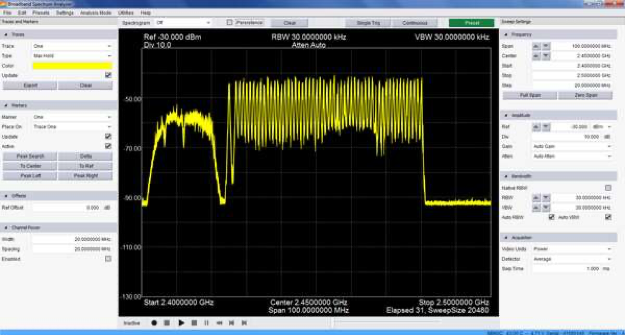
Figure 5. A combination of Wi-Fi signal on channel 1 with Bluetooth frequency hopping to the right. Notice the Bluetooth avoids the Wi-Fi signal by using an AFH protocol, which senses the presence of the Wi-Fi signal and avoids it.
In summary, I’m quite impressed with the capability and features of this real-time analyzer. I’ve seen spectral issues of devices that simply couldn’t be seen using a regular spectrum analyzer with the inherently slower sweep speeds. This would be a valuable tool for troubleshooting intermittent EMI issues or identifying problems with wireless transmitters. The persistence mode is a useful tool for identifying infrequent signals. While the real-time mode is limited to just 27 MHz due to the processing limitations of today’s laptops, it is still very useful in capturing fast responding signals. It’s easy to save screen shots using the built-in function. I love the small size and the fact I can carry a high performance 6 GHz analyzer in my briefcase.
The top-of-the-line Signal Hound BB60C real-time spectrum analyzer may be ordered directly from the company’s web site and costs just $3,160. Highly recommended, assuming you have the PC horsepower required. The full review can be found here.
Tektronix RSA306B spectrum analyzer
The RSA306B is powered solely through the USB 3.0 port (see Figure 6). The frequency range is 9 kHz to 6.2 GHz and can measure from +20 to -160 dBm (at minimum resolution bandwidth of 100 Hz). The unit can capture fast transient pulses with its 40 MHz real-time IF bandwidth. There are also external 10 MHz reference and trigger/sync SMA inputs, so you can sync to line frequencies. The measurement input is an N connector with protective rubber cap. With all this, Tektronix has been able to keep the cost down to just $5,100 for the basic unit. Included in this price is a safety/installation manual, USB 3.0 cable, and USB flash drive containing the documentation files, user manual, drivers and SignalVu-PC software ($1,300).

Figure 6. The Tektronix RSA306B USB-controlled real-time spectrum analyzer covers 9 kHz to 6.2 GHz and has a real-time bandwidth of 40 MHz. The base cost is $5,100 and there are several digital modulation display options. It's a small package that can easily fit into a briefcase, along with your laptop.
One reason for the low cost is that much of the functionality lies in the SignalVu-PC RF analysis software. The software includes 17 standard spectrum and signal analysis measurements, with several optional application-specific options available. These options include mapping, modulation analysis, standards support (such as APCO P25 and WLAN), pulse measurements, and frequency settling.
The real-time (DPX mode) can detect transient or intermittent signals as short as 100 µs, which would aid in interference hunting. The software can also capture streaming and audio demodulation for long-term surveillance monitoring. Because the personality of the instrument lies within the software, upgrades and adding optional measurement capabilities are easy.
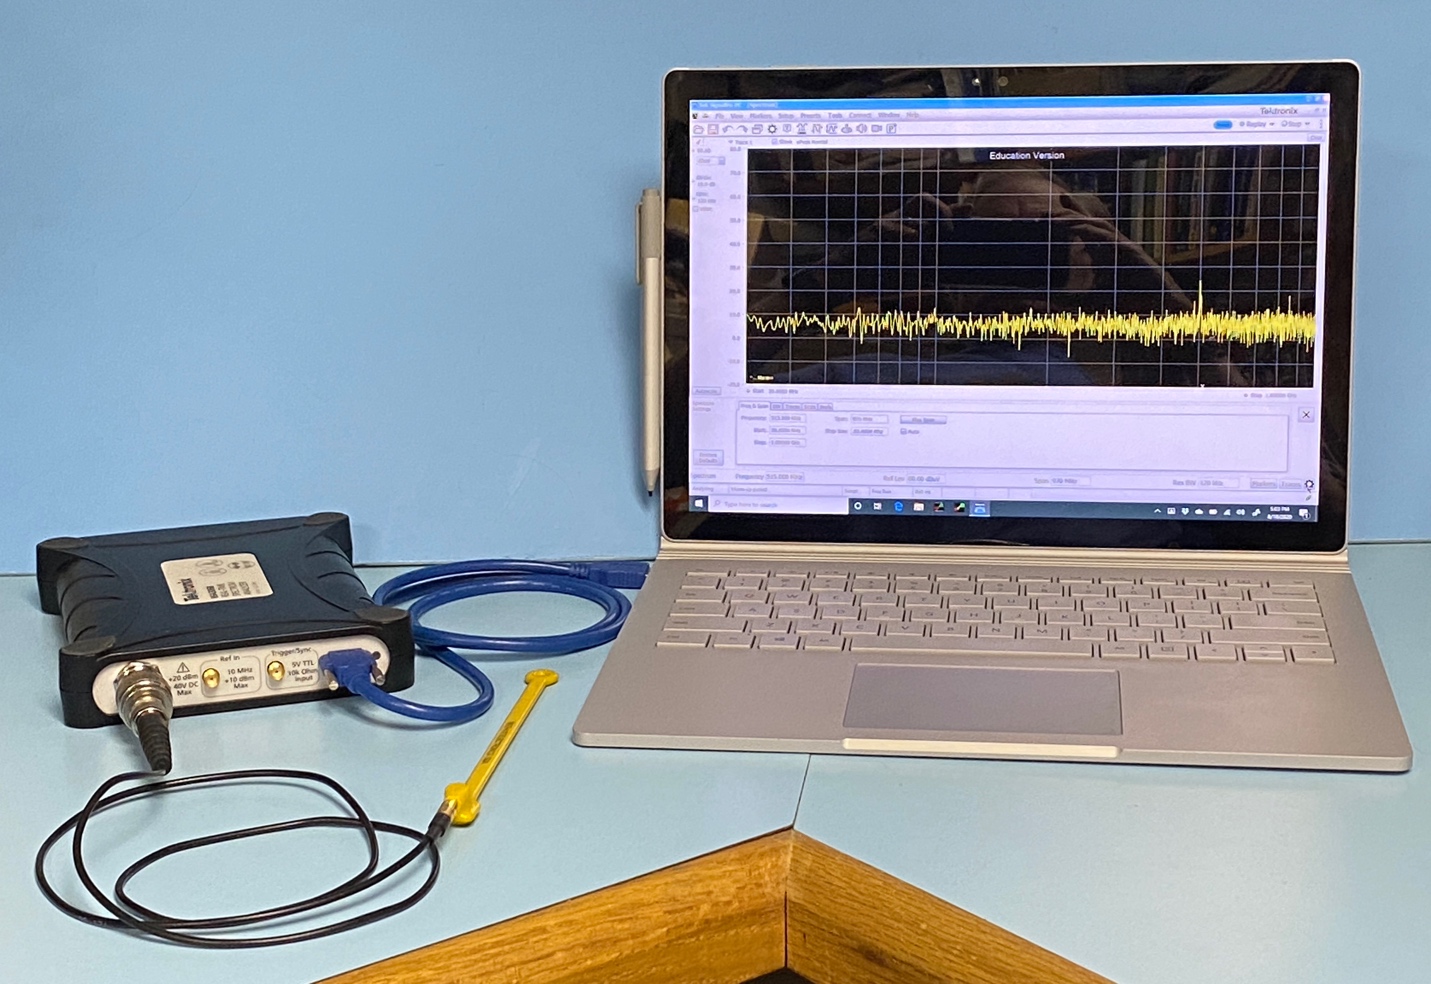
Figure 7. The RSA306 connected to a PC laptop running Windows 10 ready to test.
As you might imagine, the PC requirements are pretty stringent, as all the digital signal processing occurs there. Tektronix recommends a PC with at least a USB 3.0 port and 64-bit Windows 8, or 10 OS. For full support of the real-time features, an Intel i7 4th-generation processor and 8 GB of RAM is required. Figure 7 shows the measurement setup.
Installation of the software was made easy with the supplied USB flash drive and I was soon up and operating in short order. The layout of the software user interface (UI) was pretty straightforward. There is the typical menu bar along the top (file, view, setup, tools, etc.). The vertical scale controls are located along the left of the display and the horizontal scale; resolution bandwidth, trace, marker controls are along the bottom. Located under the main menu bar are the recording and replay controls indicated by standard record/play icons. The UI may be controlled with either a mouse or touchscreen, if your PC is so designed.
The default display is the spectrum mode with a single trace (see Figure 8). However, there are up to three traces that may be displayed, with separate controls for each. There is a math feature that can subtract one trace from another and this fourth “Math” trace may be displayed, as well.
There are five markers available and there’s also a spur detection mode, which records all spurs between 9 kHz and 1 GHz that are above a specified threshold (default setting) and the upper limit may optionally be increased to 6.2 GHz (full band). This would be ideal for quickly identifying a series of harmonics, where just the top several could be recorded.
There are six trace detection modes: +Peak, -Peak, ±Peak, Average (VRMS), Average (of logs), and Sample (described below). Trace processing includes normal, average, max hold, and min hold. Traces may be saved and recalled for display later or saved to a file. As well, instrument setups may also be saved and recalled.
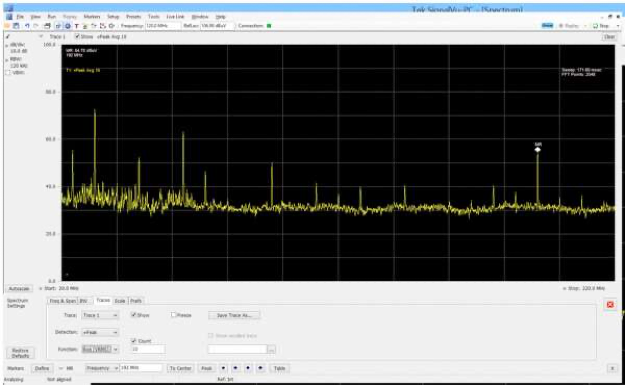
Figure 8. Spectral plot showing several harmonics from the Arduino controller. This also shows the layout of the UI.
Emissions Pre-Compliance Testing
It couldn’t be easier to set up an automated EMI pre-compliance measurement. Purchasing the EMCVu option includes pre-programmed FCC, CISPR, and MIL-STD-461 limits from 30 MHz to 6.2 GHz in either linear or logarithmic displays. The limit lines may be adjusted for external gain or loss factors, such as external preamps, antenna factors, and cable loss. Up to three gain/loss tables may be added. Normally, you would use this for temporary or permanent 3m or 10m test ranges, however, for the purpose of this example, I’m connected to an H-field probe and measuring the emissions on a small, embedded processor board (see Figure 9).

Figure 9. A display of harmonics from a small, embedded processor board. Note the “failing” frequency at 269 MHz in this simulated pre-compliance test. Normally, you’d use this measurement using an antenna at 3m or 10m from the product under test, using compensated limit lines. Also shown is the table where up to three sets of gain/loss data may be entered to automatically adjust the limit lines.
All harmonics over the limit line are flagged with a triangle and highlighted in red on the frequency listing. The frequency listing also reads out the margin from the limit. You also have the option to display only the failing frequencies in order of frequency or margin.
Wi-Fi and Bluetooth Interference Analysis
The DPX mode is essential for analyzing Wi-Fi and/or Bluetooth (BT) coexistence or interference issues. In this next example, I’m measuring the over-the-air (OTA) Wi-Fi and BT signals in my home office (see Figure 10). I’ve enabled persistence mode, so you can easily observe multiple Wi-Fi signals, as well as the frequency hopping BT signals.

Figure 10. A display of both Wi-Fi and Bluetooth signals. Wi-Fi channel 1 shown.
The size, price point, and rugged quality of the RSA306B, as well as the functionality Tektronix has built into the SignalVu-PC and pre-compliance features of the EMCVu-PC software is very impressive. This is a relatively low-cost analysis solution for companies who wish to perform EMI pre-compliance testing or troubleshooting of their products prior to formal compliance testing. The digital signal analysis features also make this a great solution for analyzing today’s wireless networks and protocols. Highly recommended!
Siglent SSA3075X-R and Rigol RSA5000 Real-Time Spectrum Analyzers
Digital circuitry can produce a wide range of harmonic frequencies and spectrum analyzers can show you this RF frequency spectrum (power or voltage), versus frequency. They are the one piece of gear that’s essential for EMC troubleshooting. But these instruments have traditionally been the most expensive item in anyone’s kit. However, several manufacturers are now making affordable quality instruments that are perfectly adequate for troubleshooting and pre-compliance work.
Both Rigol and Siglent Technologies released affordable swept spectrum analyzers several years ago and recently, both released real-time analyzers.
Rigol RSA5000-series
Figure 11 shows Rigol's top-of-the-line real-time spectrum analyzer, the RSA5000-series. The series ranges from $5,999 to $9,999, depending on the upper frequency (6.5 GHz, max). The real-time bandwidth upgrade to 40 MHz option is $1,499 and the automated EMI measurement software is $999.
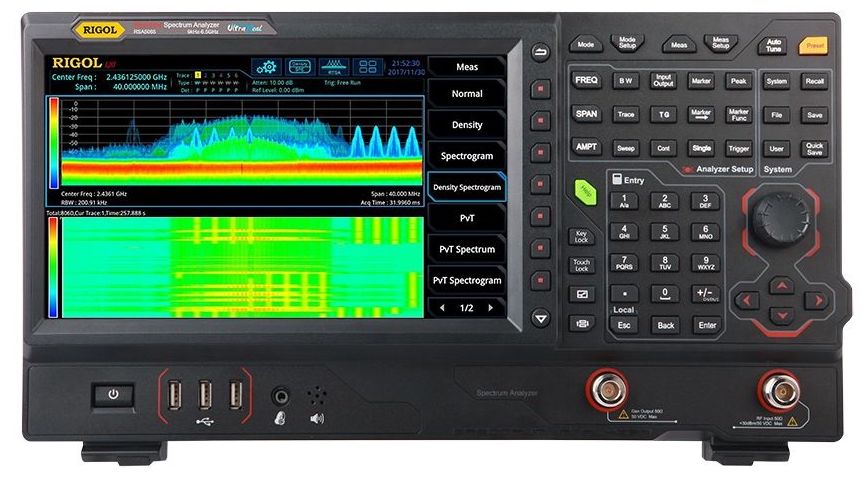
Figure 11. Rigol's RSA5000-series real-time spectrum analyzer covers an upper frequency of 3.2 to 6.5 GHz, depending on the model. The basic unit comes with a 10 MHz RT BW and can be upgraded to 40 MHz. Image, courtesy Rigol Technologies.
Rigol also sells the more affordable RSA3000-series for $3,999 to 6,199, depending on the model. The upper frequency ranges from 3.0 to 4.5 GHz.
Rigol RSA3000-series
Rigol also sells the more affordable RSA3000-series for $3,999 to 6,199, depending on the model. The upper frequency ranges from 3.0 to 4.5 GHz.
Siglent SSA3000X-R-series
I had a chance to borrow Siglent’s SSA3000X-R-series of real-time spectrum analyzer (see Figure 12) and was able to compare it to their SSA3032X swept analyzer. It uses the same compact form factor as their swept model. The model reviewed was their SSA3075X-R that can tune from 9 kHz to 7.5 GHz. Other real-time models include top frequencies of 3.2 and 5 GHz. All offer free vector network analyzer (VNA) and distance to fault (DTF) measurements. A preamplifier and tracking generator is standard. The EMI bandwidths and quasi-peak detector functions are optional, but recommended.
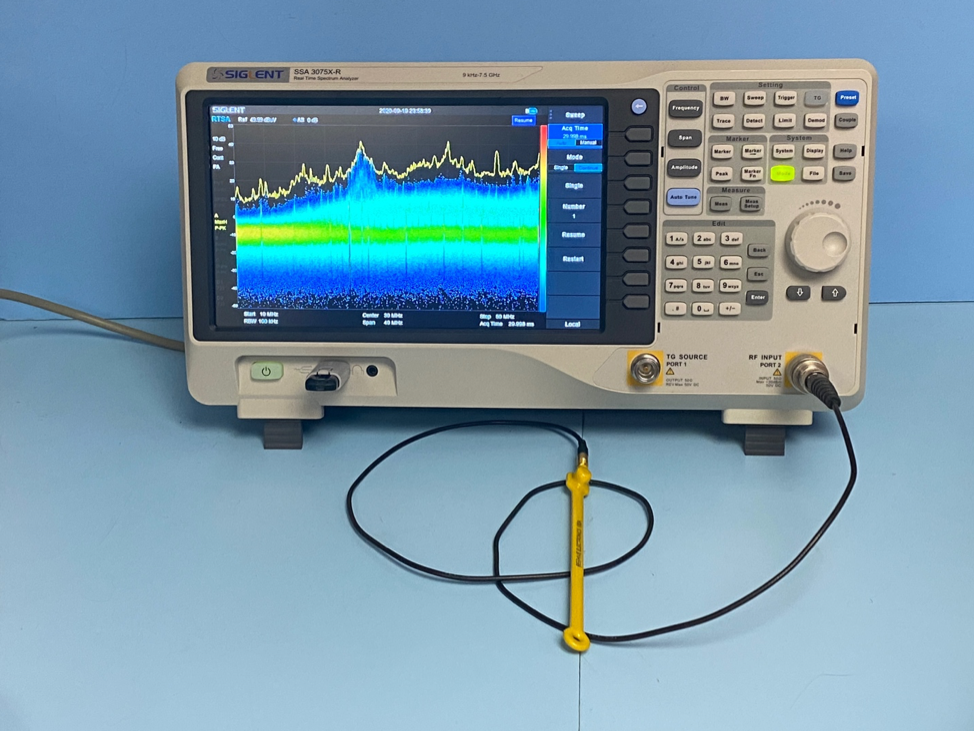 Figure 12. The Siglent SSA3075X-R real-time spectrum analyzer ready to troubleshoot.
User Interface
The UI is basically the same as their swept models, except parts are more refined and there is now the choice between normal swept and real-time modes. The ability to use a mouse or keyboard is a definite plus.
Display
The basic layout of the display is the same, but the resolution and fonts used are clearer. Soft keys are arranged on the right side and user modes on the left. Measurement settings are arranged along the bottom. The screen can be controlled using “multi-touch,” mouse or keyboard.
Speed
The real-time model is fast! To be able to display acquired data in near real-time, the internal processing speed must use the fastest processors available, and it shows. For example, setting up both the swept and RT models to the same parameters (span, RBW, etc.); the swept model showed a display speed of 57 ms while the RT model was 4 ms (see Figure 13). That’s a 14X faster sweep rate.
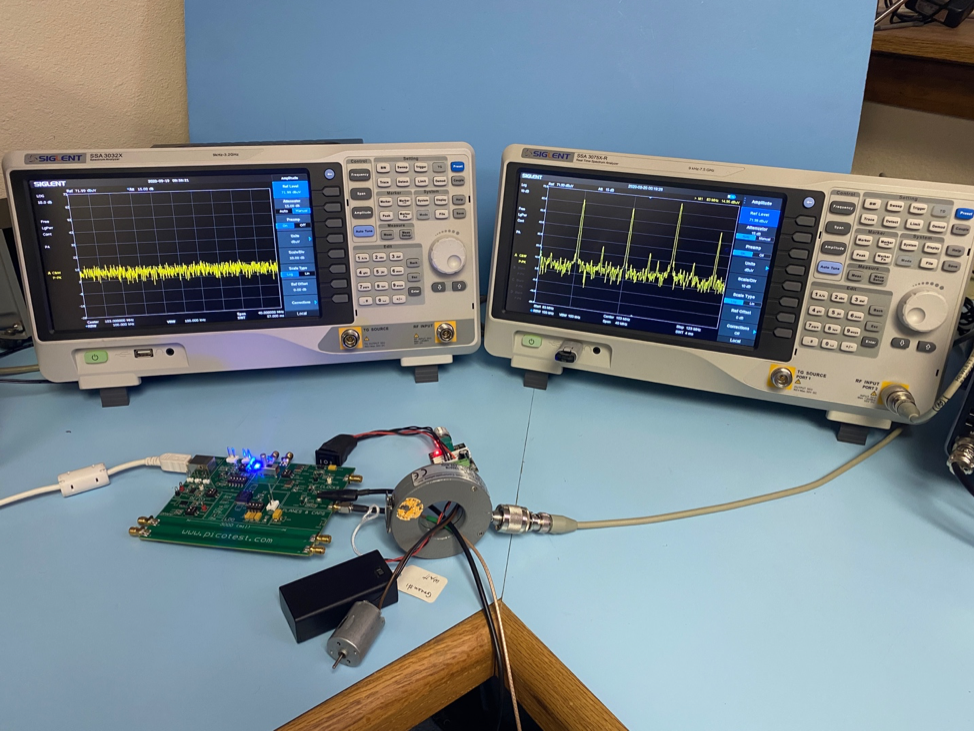 Figure 13. A comparison of the swept and real-time analyzers (both in swept mode) showing the relatively faster sweep time of the SSA3075X-R (57 versus 4 ms sweeps).
RT Bandwidth
The base model comes with a 25 MHz RT bandwidth, which is just OK for most EMI analysis. For more serious EMI analysis, they do have a 40 MHz RT bandwidth option for an extra $1,400, which I recommend.
General Performance
Both the swept and RT analyzers appear to have the same sensitivity. Advertised display average noise level (DANL) is -165 dBm/Hz. Phase noise is pegged at less than -98 dBc/Hz, and resolution bandwidths (RBW) can be set between 1 Hz and 3 MHz. Amplitude accuracy is less than 0.7 dB. Real-time capture is advertised to be less than 7.2 µ for a 100% POI.
Example Measurements
Embedded Processor
In this test, I’m simply measuring the typical digital processor bus activity using a medium-sized Beehive Electronics H-field probe, which is my favorite size for general PC board characterizations (see Figure 14). The analyzer is looking from 10 to 50 MHz (40 MHz real-time span) and we can see a combination of narrow band and broadband EMI. Note that the broadband bus noise is nearly covering up all the narrow band clock harmonics.
 Figure 14. Using the real-time mode to capture digital processor data bus EMI.
 Figure 15. A screen capture of the processor bus EMI. The thin yellow line is the equivalent of “Max Hold” in a swept analyzer and indicates the maximum amplitude of the measurement.
Figure 15 shows a clearer picture of the narrow band clock harmonics and superimposed digital bus noise. The thin yellow line is an indication of the maximum broadband amplitude, which is pulsing up and down according to the firmware programming. Note that in real-time mode, you can clearly observe both the narrow band and broadband emissions.
Motor Noise
For this test, I’ll use an RF current probe to measure the harmonic currents on some cables attached to a demo board which includes a 100 MHz clock, along with some digital processing. I’m also adding a digitally-controlled DC brush motor with pulse width modulation (PWM) controller cabling through the same current probe. This will simulate a multi-function circuit and will display both narrow band and broadband EMI (see Figure 16).
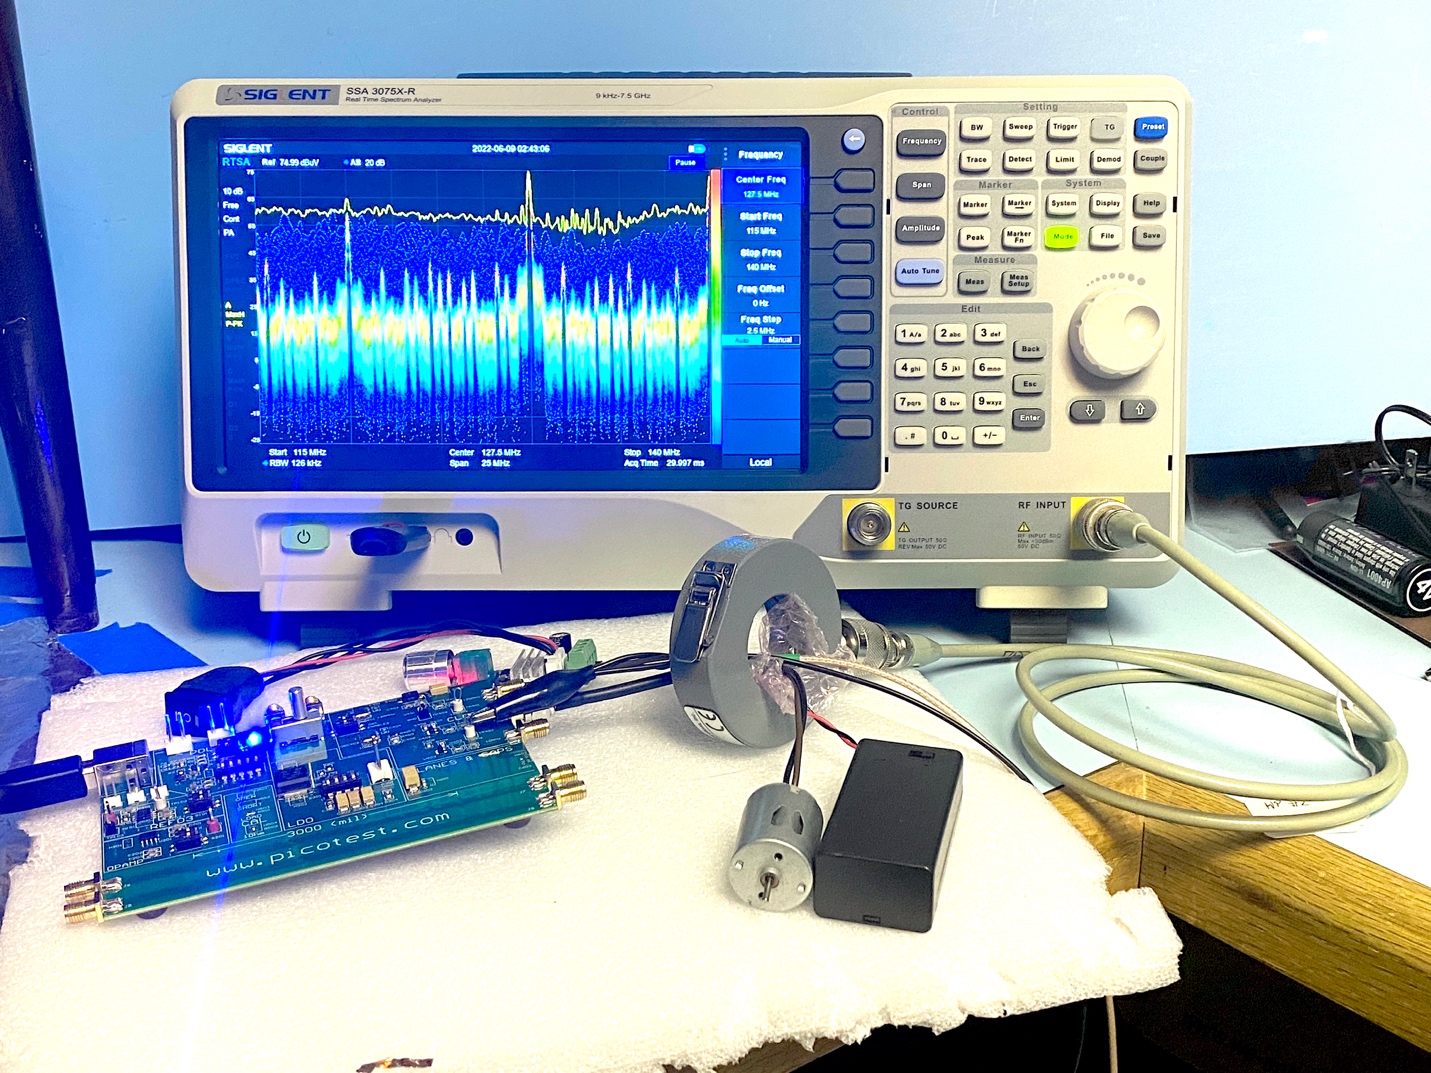 Figure 16. Now we’re using the current probe to measure harmonic cable currents from a demo board. I’ve added a PWM motor controller that will add some broadband EMI to the narrow band harmonic spikes. The thin yellow line is the equivalent of “Max Hold” in a swept analyzer and indicates the maximum amplitude of the measurement.
Figure 17 shows a closeup of the combined narrow band EMI and broadband motor noise superimposed. Note that the broadband EMI completely covers some of the lower narrow band harmonics, but because we’re in real-time mode, we can clearly see these superimposed signals. The thin yellow line is the equivalent of “Max Hold” in a swept analyzer and indicates the maximum amplitude of the measurement.
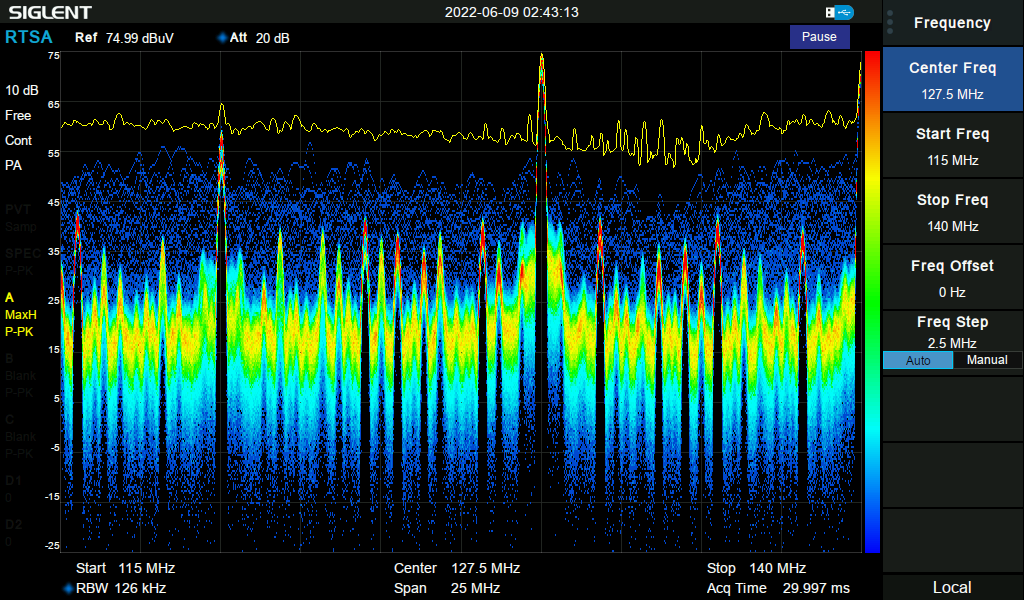 Figure 17. A screen capture of the combined narrow band harmonics and broadband motor noise. The thin yellow line is the equivalent of “Max Hold” in a swept analyzer and indicates the maximum amplitude of the measurement.
Note that motor noise – especially brush motors – can generate high amounts of broadband EMI up through 1 GHz. The thin yellow line is the equivalent of “Max Hold” in a swept analyzer and indicates the maximum amplitude of the measurement. Notice how many narrow band emissions are hidden by the broadband motor noise?
Broadband EMI can rarely be measured accurately using swept analyzers, due to the dead time between measurements. Max hold mode on the swept analyzer can capture this broadband noise, but you generally have to wait a couple minutes for the envelope to completely fill in, and this ends up obscuring any narrow band emissions. Sometimes, this broadband noise can cover up the narrow band harmonic spikes completely.
If you’re attempting to perform radiated emissions testing at a compliance test lab and their swept spectrum analyzer happened to record a burst of broadband EMI, it could indicate a failure. By using the real-time analyzer back at your work bench, you’d have known the issue right away and could have resolved it ahead of time through normal filtering or shielding.
Summary
For those requiring detection and display of intermittent signals, interference hunting or wireless/digital modulations, then you’ll want to consider one of the real-time spectrum analyzers. The Tektronix RSA306B with EMCVu software is perfect for in-house pre-compliance testing and can display 40 MHz of real-time bandwidth. The Signal Hound BB60C is a little more affordable, yet still provides a 27 MHz real-time bandwidth. Both can display digital modulations with all the usual parameters, such as symbol tables, quadrature modulation displays, etc.
The SSA3075X-R real-time analyzer (7.5 GHz) equipped with 40 MHz RT bandwidth and EMI options is roughly $12,200 versus the swept SSA3075X (7.5 GHz) with EMI option at $7,400. If you’re having to deal with intermittent EMI or digital modulations, then the 25 MHz RT bandwidth may work out as a minimum, however the 40 MHz RT bandwidth is recommended as best for all-around EMI debug. I’ve not had a chance yet to review the Rigol RSA3000 or 5000-series real time analyzers, but hope to follow up later with an article.
While this article mainly addresses the more affordable real-time spectrum analyzers, I would also consider those instruments from the more mainstream manufacturers, such as Aaronia, Gauss Instruments, Keysight, Rhode & Schwarz and Tektronix' higher-end analyzers. For a more in-depth discussion on the theory and architecture of real-time spectrum analyzers, please refer to reference 9.
References
- Aaronia
- Gauss Instruments
- Keysight Technologies
- Rohde & Schwarz
- Rigol Technologies
- Siglent Technologies
- Signal Hound
- Tektronix
- Wyatt, Real-Time Spectrum Analyzers, Interference Technology, 2016.
The above is a partial excerpt from Volume 1, Chapter 2 of 'Creating Your Own EMC Troubleshooting Kit,' by the same author.