

Digital circuitry can produce a wide range of harmonic frequencies, spectrum analyzers can show you this RF frequency spectrum (power or voltage), versus frequency (see Figure 1). They are the one piece of gear that’s essential for EMC troubleshooting. But these instruments have traditionally been the most expensive item in anyone’s kit. You can buy a decent lab-quality bench top portable one for $10k to $20k, and used ones go for $1k to $5k if you don’t mind the 30 to 80 pounds of weight, or the initial investment.
Many smaller or mid-sized companies may not have the budget to purchase a lab quality analyzer, however, several manufacturers are now making affordable quality instruments that are perfectly adequate for troubleshooting and pre-compliance work. I’ve listed several instruments from which to choose.
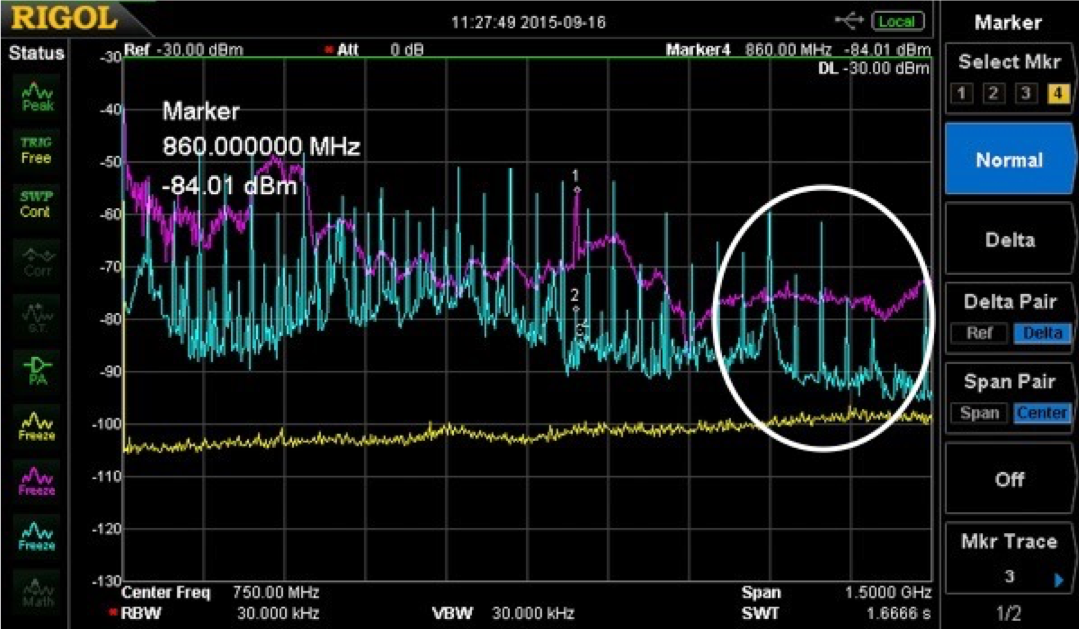
Figure 1. A typical spectrum analyzer display showing narrow band harmonics from an Ethernet clock and broadband emissions from a DC-DC converter. Both extend beyond 1.5 GHz! The white circle indicates the U.S. LTE cellular and close to the GPS band at 1575 MHz.
Choosing a Spectrum Analyzer
There are several important characteristics to consider before purchasing a spectrum analyzer: cost, frequency range, allowable frequency span, form factor, and acquisition type.
Cost – the cost can range from $50 to $5,000, but several good benchtop analyzers may be purchased for around $2,000. Portable analyzers can range from $100 to $2,500, depending on quality and features.
Frequency Range – Many analyzers can cover up to 1 GHz, which would be the minimum desired frequency for general troubleshooting. Some EMC tests require measurement down to 10 kHz (for military/aerospace) or 150 kHz (for commercial/industrial). Depending on the product, highest clock frequency and EMC standard, the upper frequency range might extend to 6 GHz (commercial/industrial) or 18 GHz (military/aerospace).
Allowable Frequency Span – This is not generally an issue for most commercial spectrum analyzers, but some of the lower-cost software defined radios (SDRs) that may be used as spectrum analyzers are limited in the span of frequencies they can display. This can be an issue for troubleshooting, because it limits what you can see at one time.
Form Factor – The most useful analyzers will be ones that are designed for benchtop use. The more recent affordable analyzers also have smaller footprints, allowing more room on your bench for troubleshooting. For field use or if you need to bring an analyzer on your travels, a portable would be something to consider. There are also a class of analyzer that is USB-controlled and are dependent on an attached PC laptop for display and control.
Acquisition Type – There are basically two types of measurement acquisition: swept and real time. Swept analyzers are very similar to classic oscilloscopes in that the frequency span is “swept” between the start and stop frequencies, then analyzed and displayed in a series of events (sweep – analyze/measure – display), so there is some deadtime between sweeps while the system is measuring, processing the data and displaying the results. This can miss some pulsating or intermittent frequency captures. Real time acquisition, on the other hand, is a much faster process of capturing and displaying frequency information at such a rapid process that it appears as if the display is showing captured data in “real time”. This fast acquisition depends on extremely fast A/D conversion, simultaneous FFT processing, and powerful computer processors. Real time analyzers can generally capture impulsive RF events down to 1 us and are very useful for displaying intermittent interference or digital modulations and their characteristics.
Budget/Hobby Analyzers
The following are probably not instruments for serious EMC troubleshooting but do have the ability to display both broadband and narrow band harmonic energy. They should be useful for gross checks on emissions, but are really designed for the electronics hobbyist.
RF Explorer – for the hobbyist or company with a severe budget limit, you might consider the RF Explorer, which will cost $130 (see Figure 2). While the frequency range is just 240 to 960 MHz (an optional $60 Wi-Fi module add-on is available), it is still a reasonable troubleshooting tool for the higher harmonics. The DANL is not too good at -90 dBm, but it’s sensitive enough that I can plug a near-field probe directly into the SMA input and observe a decent signal.
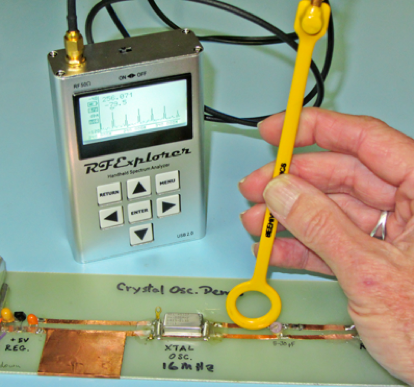
Figure 2. The RF Explorer model WSUB1G tunes from 240 to 960 MHz and costs $130.
Too narrow a frequency range? The designer of the RF Explorer has announced an improved model, the WSUB3G, that will tune from 15 MHz to 2.7 GHz with a price of $260. Both RF Explorer models are available from Seeed Studio, a hobbyist electronics supply store, in Shenzhen, China.
The AirSpy (a budget SDR-based spectrum analyzer) – there have been several spectrum analyzers introduced based on software-defined radio (SDR) that are extremely low cost and suitable for general-purpose EMI troubleshooting. This tiny module (see Figure 3) is actually a high quality SDR that can tune from 24 MHz to 1.8 GHz and is sensitive down to -130 dBm. If you need to go down further in frequency, they have the companion Spyverter that tunes from DC to 60 MHz. Both units are controlled via USB and the processing is performed by a standard PC running Windows.
A special effort was made to provide shielding and I/O connector transient protection. The cost for the AirSpy is just $199 and the Spyverter is an extra $59. Both may be ordered from AirSpy’s web site.
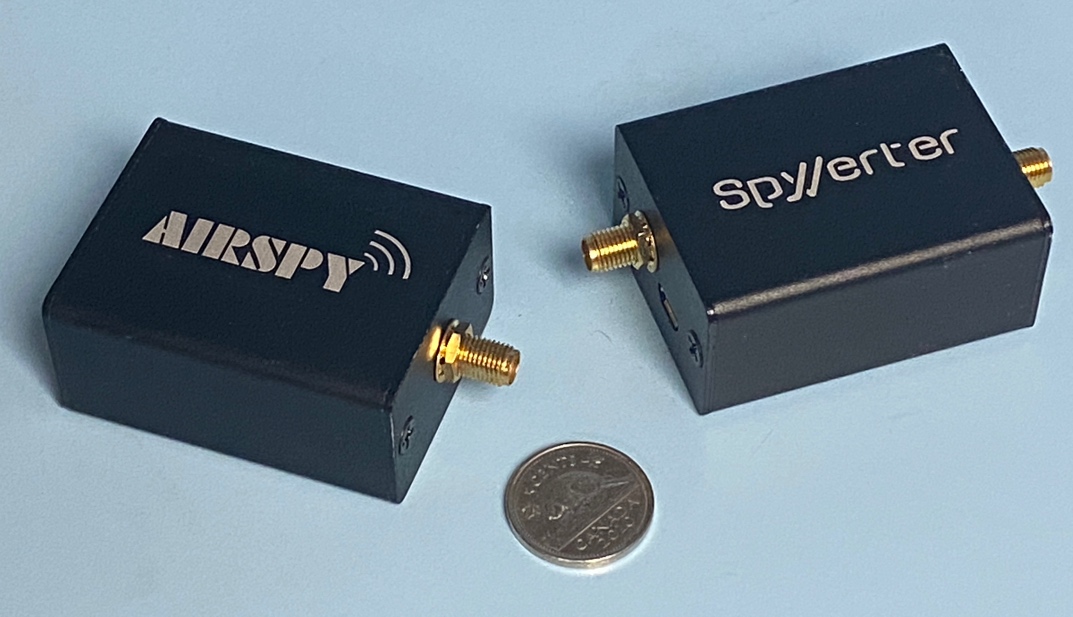
Figure 3. The AirSpy software defined radio (on left) may be used successfully as a budget spectrum analyzer. Also shown is the Spyverter low frequency converter (on right) which allows tuning from “DC” to 60 MHz.
When driven from the free “Spectrum Spy” PC-based software, AirSpy can display a relatively accurate spectral plot (see Figure 4). Note, also, the “waterfall” display feature, that records frequency versus time. This is useful for tracking down intermittent EMI pulses or radio transmissions. In addition, the software allows a continual recording of the emission to the PC’s disk drive (up to its capacity).

Figure 4. The AirSpy measuring the emissions from an embedded processor board. The 270 MHz processor clock may easily be observed.
The AirSpy web site includes links for a variety of useful software applications. The commonly-used “SDR#” (pronounced “SDR Sharp”) may be used, but is limited to a span of just 10 MHz.
I would recommend downloading the SpectrumSpy application, as that more closely duplicates the controls of a normal spectrum analyzer. Missing are a lot of niceties, such as measurement in dBuV, max hold, markers, adjustable resolution bandwidths, etc., but the SpectrumSpy does work for general measurements; center frequency, span, and upper/lower frequency limits may all be specified. One nice thing is that the span is not limited to just 10 MHz, but can display a wide band of frequencies – much more useful for EMI troubleshooting. Note that the amplitude is only available in dBm.
Both the frequency accuracy and amplitude accuracy are acceptable. I’m not sure I’d use this product for pre-compliance testing, but for general troubleshooting and educational use, it should perform well.
Tiny Spectrum Analyzer – the "TinySA" has taken the hobbyist community by storm (see Figure 5). This under $100 swept spectrum analyzer is available through Amazon and many other sources. Because there are so many underperforming clones, the official development organization (https://www.tinysa.org/wiki/) has information on obtaining the "real deal."
A safe seller is Amazon, but there are many others listed in the Wiki.

Figure 5. The TinySA can tune from 100 kHz to 350 MHz and 240 to 960 MHz in two bands.
The general specifications include:
- Spectrum analyzer with two inputs, high quality MF/HF/VHF input for 0.1MHZ to 350MHz, lesser quality UHF input for 240MHz to 960MHz or
- Signal Generator with two output, sine output for 0.1MHz to 350MHz and square wave output for 240MHz to 960MHz when not used as spectrum analyzer
- Switchable resolution bandpass filters for both ranges between 2.6kHz and 640kHz
- Color display showing 290 scan points covering up to the full low or high frequency range.
- Input Step attenuator from 0dB to 31dB for the MF/HF/VHF input
- A built-in calibration signal generator that is used for automatic self-test and low input calibration
- Connectivity to a PC via USB (PC-controlled spectrum analyzer or signal generator)
- Rechargeable battery allowing a minimum of at least 2 hours portable use
- CAUTION: Max input level +10dBm.
There are certain limitations with this small and low-cost design:
- The internal phase noise sets a clear lower limit for phase noise measurements
- The minimum resolution bandwidth of 2.4kHz makes it impossible to see more spectral detail
- The high input (240MHz to 960MHz) has very limited image suppression and only one level optional built-in attenuator which makes it difficult to interpret complex signals
- The high input optional input attenuator is frequency dependent and varies between 25dB and 40dB
- At lower resolution bandwidths (below 30kHz), the measurement time per point starts to increase due to the resolution filter implementation
- The performance limitations of the shielding and the filters may lead to certain images and spurs being visible, but certain functions like spur suppression and switching to below IF may help detect and/or reduce these spurs and images
- Below 0.1MHz the sensitivity starts to reduce
- Below 1MHz it is recommended to disable the automation gain control (AGC) and possibly enable the low noise amplifier (LNA) to get best measurement quality
- When using the supplied telescopic antenna or a low RBW one should be aware of the radiation from the TinySA MCU on 48MHz and its harmonics
However, for general emissions troubleshooting, this may be all you need. The display includes markers along with a waterfall display. It can also be controlled through USB by a PC with free software.
Professional Portable Analyzers
Professional portable analyzers are useful tools for more serious EMC troubleshooting and characterization. For instance, I have been using the AIM-TTi portable analyzers, or their early predecessors, for 25 years and find them to be easy to transport and useful for scanning large systems with the larger H-field probe attached directly to the input.
AIM-TTi PSA2702T Handheld Spectrum Analyzer – if you need higher quality portable spectrum analysis in the field, you might consider the hand-held Thurlby Thandar Instruments (AIM-TTi) PSA2702T (see Figure 6). I've used one of these for years and recently upgraded to the 6 GHz bandwidth model described further down.
The PSA2702T covers 1 MHz through 2.7 GHz and includes three resolution bandwidths: 15 kHz, 280 kHz, and 1 MHz. There are two markers that can read out amplitude and frequency, as well as delta. Limit lines may be defined and the unit may be programmed to beep, stop the sweep, log the sweep, or provide an output pulse if the limit is exceeded. Base price is $1,695.
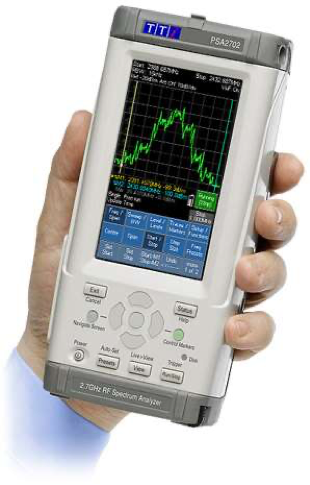
Figure 6. The Thurlby Thandar PSA2702T is an affordable portable spectrum analyzer that covers 1 MHz to 2.7 GHz. The cost is $1,695 from Saelig or Newark Electronics (Photo courtesy of Thurlby Thandar Instruments).
The unit can display amplitudes in dBm, dBuV, mV, or uW, and there are two reference levels: 0 and -20 dBm. There is a simple video filter (on/off), but it also includes averaging and “peak hold.” Amplitude and frequency accuracy is reasonable for a unit this size and are fine for general troubleshooting purposes. However, you'd want to move to a lab-grade analyzer for the most accurate measurements or compliance testing. Setup configurations may be saved and recalled, and the screen may be captured and stored in internal memory or USB thumb drives. Currently, not all thumb drives are supported. Only ones that conform to the USB Mass Storage Class (MSC) and have capacities from 32 MB to 32 GB will work. I had to try a handful before I found one that would work for me. Further details on this are included in the manual.
The instrument has large 5.5 by 9.5 cm (4.3-inch) backlit TFT LCD display with a useable waveform display area of 5.5 by 5.5 cm (2.25-inch square). The remaining portion of the display is devoted to status indicators and a three-tiered menu arrangement. I like the fact the nested menus are always visible, and I rarely have to guess where to find a function. The display is clear and easily readable. The new model also comes with a hinged protective cover that can snap off and remount to the rear to prop up the unit (see Figure 7). The Li-Ion battery seems to last for weeks. I’ve only had to charge mine about once a month to top it off.
The unit even includes AM/FM demodulator circuitry and an earphone jack at the top for evaluating potential commercial ambient signals. There are a few key hardware controls for markers, presets and run/stop, but most are touch-sensitive soft-keys.
Additional features with option U01:
- Limit lines and limit patterns with limits comparator
- Data logging of peak values, complete traces, or screen
images from timer, external trigger, or limits comparator - Sweep triggering from external trigger or limits comparator
- Compensation tables, fixed offsets, and 75R compensation
- Capability to show screen contents on a PC

Figure 7. The PSA2702T with screen protector flipped up. The protector may be removed and added to the back to prop up the unit.
Troubleshooting with the PSA2702T and attached probe is fast and easy. By attaching a near field probe directly to the analyzer, you have the perfect hand-held emissions detector. While the unit lacks the standard EMI bandwidths (for example, 120 kHz), I don’t find this to be a limitation during the troubleshooting process. What you’re typically looking for is relative changes. Once the fixes are implemented, that’s when it’s time to measure your product in a chamber with the proper equipment as specified in the appropriate EMC standards.
Summary – While the PSA2702T does not offer the typical EMI bandwidths or quasi-peak detection, it does include a number of very handy features for general EMC troubleshooting. Things like markers, peak search, averaging, peak hold, waveform memory, amplitude scale in dBm or dBuV, screen capture, and instrument setup memory – not to mention the portability – are very powerful tools for the EMC engineer.
Using this low-cost instrument to perform the initial troubleshooting prior to moving the product out to a compliance test facility will save both money and time. This truly handheld spectrum analyzer may be purchased for about the monthly cost of renting a bench-top analyzer. I highly recommend purchasing the PSA2702T-USC, which includes a protective carry case, option U01 and a 12V DC power cable. The U.S. distributor is Saelig Electronics or Newark Electronics and it sells the above package for under $1,800.
AIM-TTi PSA6005 Handheld Spectrum Analyzer – Thurlby Thandar also has a 6 GHz model, the PSA6005, which uses the same package as the PSA2702T (see Figure 8).
Much of the functionality and specifications remain the same as the model PSA2702T, but it covers 10 MHz through 6 GHz. AIM-TTi sells a lower-cost unit, the PSA3005, which is similar in specs, but has an upper frequency limit of 3 GHz. The new series analyzers include many more resolution bandwidths (RBWs) from 300 Hz to 10 MHz in a 1:3:10 pattern.
Video bandwidths may be adjusted over the same range or locked to the RBW. The vertical scale can be 1, 2, 5 or 10 dB per division. This is a substantial improvement in the PSA2702T RBWs of just 15 kHz, 280 kHz, and 1 MHz. There are two markers that can read out amplitude and frequency, as well as delta. Limit lines may be defined and the unit may be programmed to beep, stop the sweep, log the sweep, or provide an output pulse if the limit is exceeded. Free PSA Manager software is provided that can control much functionality and display waveforms. Used in conjunction with Option U02, it provides a very powerful tool.
The unit can display amplitudes in dBm, dBuV, mV, or uW, and there are four reference levels: +20, 0, -20, and -40 dBm – an improvement over the two levels for the PSA2702T of 0 and -20 dBm. The unit includes detectors for alternate peak (default), negative peak, positive peak, sample, linear average, log average, and RMS. Amplitude and frequency accuracy is reasonable for a unit this size and are fine for general troubleshooting purposes. However, you'd want to move to a lab-grade analyzer for the most accurate measurements or compliance testing. Setup configurations may be saved and recalled, and the screen may be captured and stored in internal memory or USB thumb drives. At this point, not all thumb drives are supported; only ones that conform to the USB Mass Storage Class (MSC) and have capacities from 32 MB to 32 GB will work. I had to try a handful before I found one that would work for me. Further details on this are included in the manual.
Option U02 provides many additional features, triggered sweep, limit patterns and comparator, channel markers, custom presets, data logging automatic measurements, offsets and compensation tables, waveform demodulation, and “View on PC,” where the waveform can be sent to the PC via USB for training purposes. Option USC includes a padded carry case.
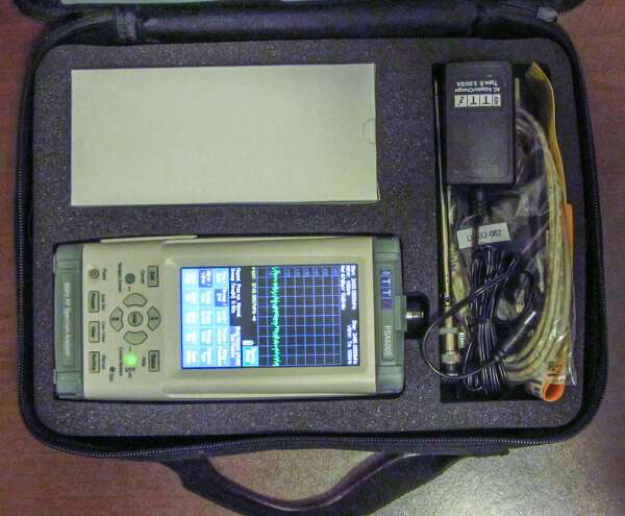
Figure 8. The PSA6005 with accessory kit and carry case (option USC).
Troubleshooting with the PSA6005 and attached probe is fast and easy. The unit is sensitive enough with the larger 2-turn Beehive loop probe that a preamplifier is usually unnecessary. By attaching a probe directly to the analyzer, you have the perfect hand-held emissions detector. While the unit lacks the standard EMI bandwidths (for example, 120 kHz for frequencies between 30 and 1000 MHz), I don’t find this to be a limitation during the troubleshooting process. I just use 100 kHz.
Emissions can be recorded via screen shots (bmp format) or tables of comma-delimited (or separated) variables (csv), which may be saved and imported into your favorite spreadsheet (see Figure 9). What I especially like is the unlimited number of instrument setups I can save. Favorites of mine include, 30 to 200 for lower-frequency emissions, 100 to 500 MHz for a lot of my typical troubleshooting, 2.4 to 2.7 GHz for Wi-Fi and Bluetooth sniffing, or 5.5 to 5.7 for the 5 GHz Wi-Fi band.
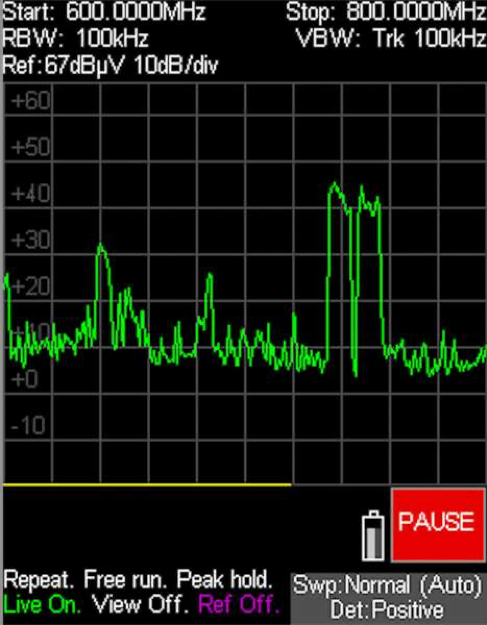
Figure 9. Screen capture showing a typical digital TV “over the air” signal.
I do wish the lower frequency range from 1 to 10 MHz wasn't lost, as this is important for conducted emissions measurements. Finally, the battery life is a much shorter at 3 hours (minimum) versus 8 hours for the 2.7 GHz PSA2702T.
Summary – while the PSA6005 does not offer the typical EMI bandwidths or quasi-peak detection, it does include a number of very handy features for general EMC troubleshooting. Things like markers, peak search, averaging, peak hold, waveform memory, amplitude scale in dBm or dBuV, screen capture, and instrument setup memory – not to mention the portability – are very powerful tools for the EMC engineer.
I usually use this instrument to get a general idea of emissions from a large system, then use it, or a bench top analyzer, to perform the initial troubleshooting. I recommend purchasing the PSA6005-USC, which includes a protective carry case, option U02 (several EMC enhancements), a telescoping antenna and a 12V DC power cable. U.S. distributors include Newark Electronics and Saelig Electronics.
Rohde & Schwarz FPH Spectrum Rider – there’s another option to consider that’s relatively affordable, considering it has similar specifications as lab quality analyzers. Rohde & Schwarz announced their FPH “Spectrum Rider” portable analyzer, whose base price starts at $5,280 (see Figure 10). I also recommend the built-in preamplifier option for $440. I had a chance to review this and was pleasantly surprised. The unit has much of the functionality as much pricier analyzers, but is a compact battery-operated portable.
While termed “handheld,” the unit is more than a handful. It matches the form factor of many of its competitors, such as Keysight and Anritsu, but it still weighs in at a hefty 5.5 pounds. The hand strap on the side does help steady it using a single hand, but I’d not want to carry it one-handed for very long. There’s also a handy rear foldout support that’s a bit finicky to unsnap, as there’s little to grasp, but, once deployed, props up the unit safely. Underneath the support leg you’ll find the replaceable lithium-ion battery and micro SD card slot for storing data and screen shots.
The instrument controls are all laid out clearly, and I really didn’t need the user guide to start using it. The unit tunes from 5 kHz to 2 GHz, with 3 or 4 GHz as options. While there’s no tracking generator option, the unit does have a lot to offer as far as accuracy and useful features. The battery life is rated at eight hours and it is moisture proof with an easy to read display, even in full sunlight. Perfect for field use!
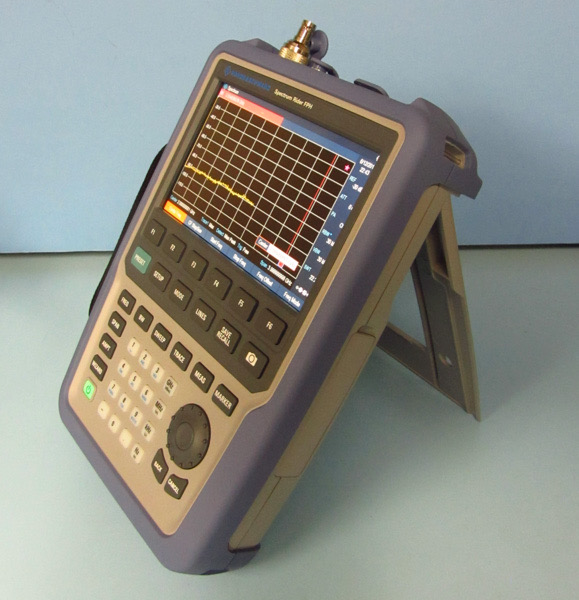
Figure 10. The Rohde & Schwarz FPH “Spectrum Rider” portable spectrum analyzer. The specifications are very similar to much higher-priced lab quality analyzers and the base price is just $5,280.
The primary controls: frequency, bandwidth, sweep, trace and measure, and marker are located above the numeric keypad, with span and amplitude going down the left side. Above that are the system keys: preset, setup, mode, lines, save/recall, and screen capture – which I love, by the way. You can configure the file name text in Settings, and then each press of the screen capture button auto-increments the count. Files are saved in JPEG or PNG format.
Setting the frequency limits is easy. You can either set center/span or upper/lower limits. The frequency offset control allows shifting of the displayed spectrum in 1 Hz increments. The bandwidth button allows control of a manual or auto BW setting. RBWs can be set from 3 Hz to 3 MHz in a 1/3/10 sequence. In like manner, sweep time may be set manually or set to auto. Setting can run from 20 ms to 1000 seconds. The scroll wheel has a center push button that serves as an “enter” control. e top panel includes the input port, external trigger/external reference input, headphone jack, and a couple of USB ports. The left side panel includes the battery charger connector and a security slot. The right-side panel includes an Ethernet and USB port. The instrument may be controlled remotely using either the Ethernet or USB ports through standard SCPI or VISA control. All ports include rubberized covers for weather protection.
The marker control allows finding the peak signal (new marker), which is immediately connected to the scroll wheel. There are six markers available with associated delta frequency and amplitude readouts in the upper display. In addition, setting a marker on a specific signal and then pressing marker function, reveals demodulation settings for AM and FM. I love the fact the marker label (“M1”) is located off the trace.
Bench Top Analyzers
For more serious EMC troubleshooting, there are several affordable choices of quality bench top analyzers. These include the Rigol DSA815 and Siglent SSA3000X-series. All of these listed are accurate enough for pre-compliance testing, where you’d set up a permanent or temporary 3m test range in-house to directly compare measurements with third-party test labs.
Rigol DSA815TG – if there’s been one spectrum analyzer that’s created a lot of buzz when it was released several years ago, it’s the Rigol DSA815 budget spectrum analyzer ($1,295), which tunes from 9 kHz to 1.5 GHz (see Figure 11). A tracking generator option will cosst an extra $200 (highly recommended), and the EMI option, which provides quasi-peak detection and the three common EMI resolution bandwidths (all of which are needed to conform to most current EMC standards), is an extra $600. There are a number of other options available.
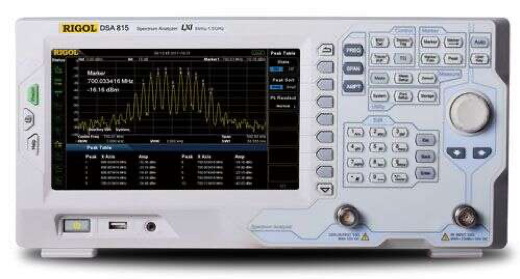
Figure 11. The Rigol DSA815TG, with tracking generator, (photo courtesy of Rigol Electronics).
The large color screen (800×480 WVGA) is clear and easily readable (see Figure 12). The controls are arranged in logical groupings, duplicating to a large degree what is found on most high-end spectrum analyzers. Besides the usual frequency, span, and amplitude buttons, major groupings include control, marker, measure, utility, and edit (numeric and text input). A vertical row of soft keys selects secondary functions. Down along the left side you’ll find a column of analyzer status icons. There’s also a “help” key that will describe each control for you.
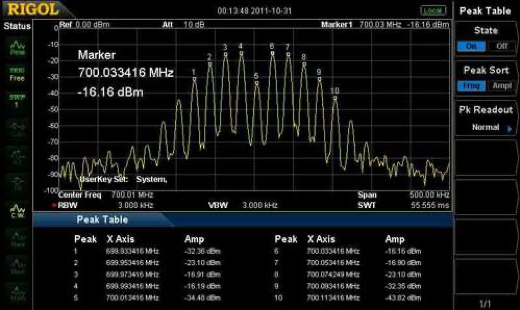
Figure 12. The DSA815 can automatically display the top ten emission peaks. Photo courtesy Rigol Electronics.
Although advertised at “up to -135 dBm displayed average noise level (DANL),” in practical use, it was more on the order of -60 to -90 dBm, depending on the frequency span and resolution bandwidths invoked. The most used controls are all one or two button-presses away.
It’s easy to save screen captures and save/recall instrument setups. The method for naming files is somewhat like entering text on regular (non-“smart”) mobile phones and is fairly quick. It would be nice to be able to plug in a keyboard for that purpose, though.
One feature I use a lot is the display line. By setting it on the baseline emission reading, you can then proceed to try various fixes while monitoring your progress. Unfortunately, it’s somewhat buried in the menu structure.
Siglent Technologies SSA3000X-Series – Siglent Technologies, based in China, released its SSA3000X-series of low-cost spectrum analyzers a few years ago. It uses the same compact form factor as the Rigol but is a little wider to accommodate the wider video display (see Figure 13). The base unit tunes from 9 kHz to 2.1 GHz, with another model going to 3.2 GHz. They've since released many higher-bandwidth models, as well as real time analyzers.
There is a similar EMI and tracking generator option. The control layout is similar to the Rigol and easy to use. Both Siglent models offer slightly improved specifications in amplitude accuracy and frequency resolution. They also display more traces and markers, and the free Windows PC software helps define limit lines and perform automated pre-compliance testing and documentation.
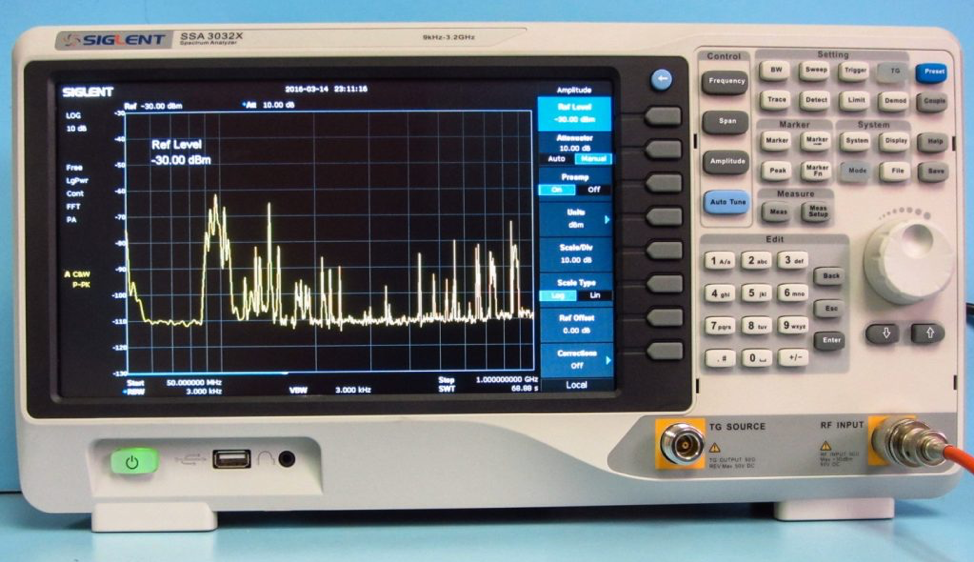
Figure 13. The Siglent SSA3000X-series spectrum analyzer tunes from 9 kHz to 2.1 GHz or 3.2 GHz, depending on the model.
Swept Spectrum Analyzer Summary
While the RF Explorer, AirSpy, and TinySA are cute and could help with emissions troubleshooting on an extreme budget, any of the other more serious analyzers should do better for you. My preference for field use remains the AIM-TTi PSA2702T because it’s fast to use, fits well into the transit case, and avoids carrying a second piece of gear. The Rohde and Schwarz Spectrum Rider is much higher quality and would also work well in the field.
The advantage of the Rigol or Siglent analyzers is that they are more accurate than the AIM-TTi PSA2702T and include a preamp, tracking generator, EMI bandwidths, and quasi-peak detector. However, for the base price, they’re limited to just 1.5 or 2.2 GHz respectively.
The tracking generators are a valuable troubleshooting tool for determining resonances, cable loss, and filter responses. Of course, both Rigol and Siglent, as well as the major manufacturers, have models that go higher in frequency for additional cost.
References
- RF Explorer models can be purchased from Seeed Studio.
- AirSpy.
- TinySA.
- AIM-TTi analyzers are available in the U.S. from Newark Electronics or Saelig Electronics.
- Rhode & Schwarz FPH Spectrum Rider.
- Rigol Electronics.
- Siglent Electronics.