
The time domain reflectometer (TDR) is an instrument that is often used to measure printed circuit board (PCB) test coupons and cable impedance. The TDR is also quite useful for measuring the inductance and capacitance of vias and component pads, probe tip capacitance and inductance, and even the parasitic inductance transceiver coupling capacitor. It is also a simple way to validate simulations or to extract your own model. High-end dedicated TDRs often include this capability, but even using a simple real-time oscilloscope-based TDR can produce these results, using a simple cursor measurement.
Theory and Simulated Result
The fundamental TDR measurement is the reflection coefficient, Γ, and this data trace is provided by nearly every TDR (including the Picotest J2151A, using the setup file downloadable in [1]). The TDR determines the impedance of the transmission line (cable or PCB trace) using a transform from Γ and the TDR impedance, typically 50Ω.

This impedance transform is also included in the above referenced setup file. For a lossless transmission line with uniform Γ (or impedance) the displayed TDR trace is a flat line, requiring little interpretation. Gated cursors are used to display the mean impedance value between the cursors.
When the transmission line is not uniform or a component is attached, the displayed TDR trace is not flat, and this is where interpretation is required.
Positive “blips” in the reflection coefficient, Γ, represent series inductance, while negative “blips” in the reflection coefficient, Γ, represent shunt capacitance.
The series inductance and shunt capacitance can be obtained from the reflection coefficient, Γ, and the TDR reference impedance, which is typically 50 Ω as:


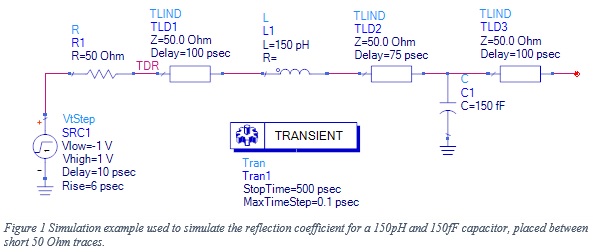
A simple simulation can be used as an example. The example shown in Figure 1 includes both a series inductance and a shunt capacitance.
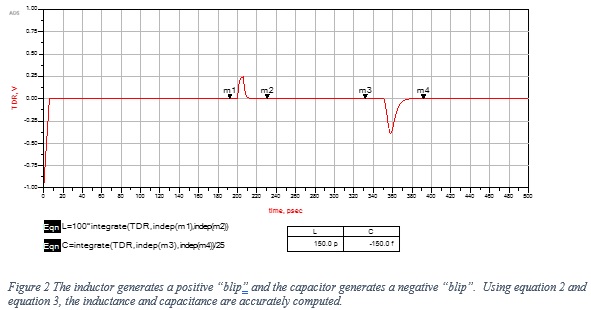
The simulation result is shown in Figure 2.
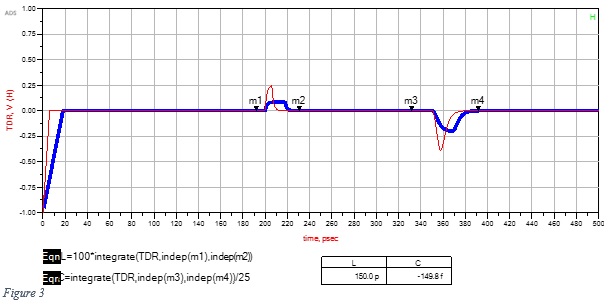
Interestingly, the bandwidth of the TDR has little impact on the result. This simulation is repeated with an 18ps rise time rather than a 6ps rise time. The result, shown in Figure 3, provides the same result as 6ps. At some point, the transmission line losses will degrade the measurement signal-to-noise ratio and the results will become questionable.
The first “blip” in this simulation result is the series inductor, which is located at the end of a 100ps lossless transmission line. The TDR sees the round-trip path, so correctly displays 200ps.
The shunt capacitance is placed 75ps after the series inductor, and again the TDR correctly sees the round-trip path as 2*(100ps+75ps) or 350ps.
Markers, placed before and after each “blip,” are used as the integration time. The placement of the markers is not critical since flat regions before and after the blip contribute little to the integration result.
Experimental Result
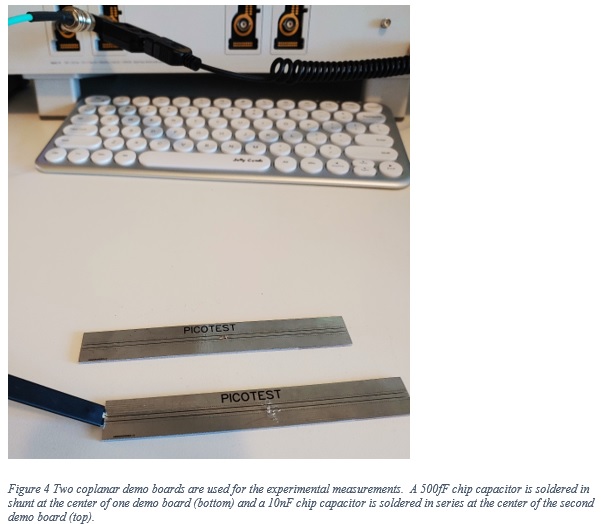
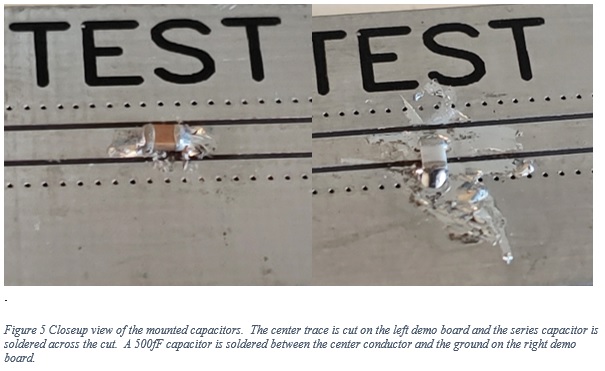
A 500fF chip capacitor is soldered between the center trace and ground of one coplanar demo PCB. The center trace of a second coplanar demo board is cut, and a 10nF series capacitor is soldered across the cut. This will allow measuring the equivalent series inductor (ESL) of the capacitor. These two demo boards are shown in Figure 4, and closeups of the mounted capacitors are shown in Figure 5.
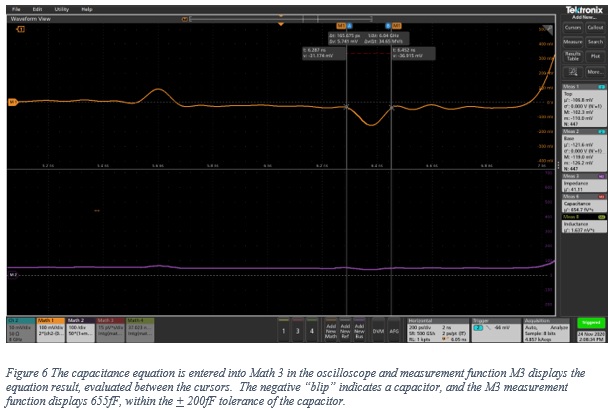
The upper data trace, shown in Figure 6, is the Γ trace measured with the shunt capacitor. The positive (inductive) “blip” on the left is the inductance of the probe tip, which we’ll measure later. The cursors are placed before and after the negative (capacitive) “blip”, which is the shunt capacitor. The gated cursor math function displays the capacitance as 655fF, which is within the 200fF tolerance of the 500fF capacitor.
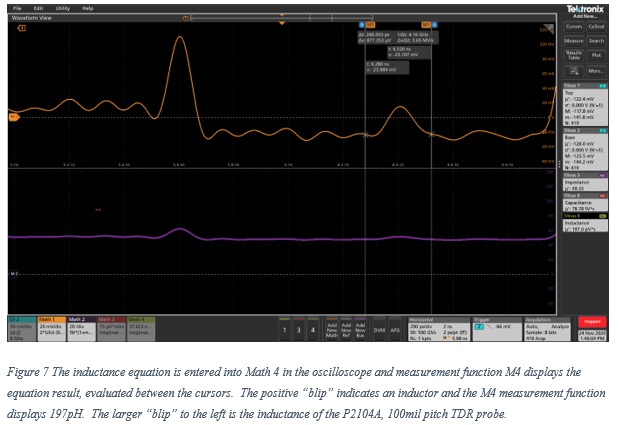
The upper data trace, shown in Figure 7, is the Γ trace measured with the series mounted capacitor. The positive “blip” on the left is the inductance of the probe tip. A larger probe is used to show the larger resulting “blip.” The cursors are placed before and after the positive (inductive) “blip” and the gated cursor math function displays the inductance as 197pH. This is the ESL of the series mounted capacitor.
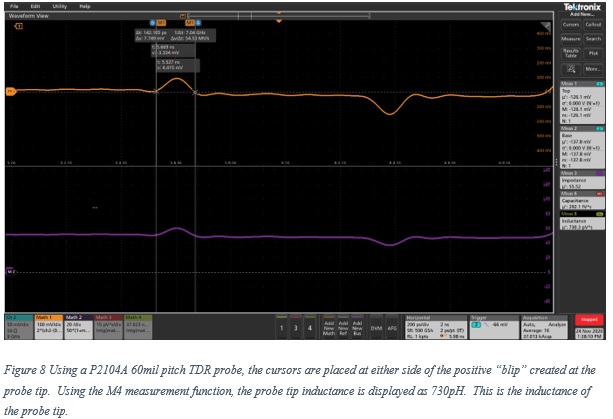
The cursor measurement can also be used to measure the inductance of the probe tip, shown in Figure 8, which is due mostly to the probe pogo pins. The positive (inductive) “blip” at the point of probe contact is measured by placing the cursors before and after the “blip.” The gated cursor math function displays the inductance as 730 pH and this inductance is the largest contributor to the probe bandwidth. The higher the inductance, the lower the probe bandwidth.
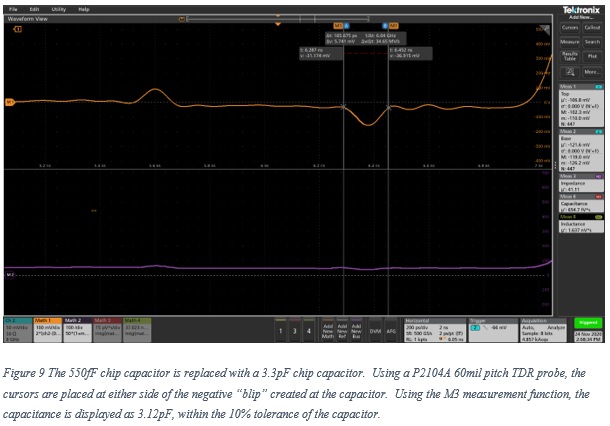
The 500fF shunt capacitor was removed and replaced with a 3.3pF chip capacitor to obtain a second experimental datapoint, shown in Figure 9. The cursors are placed before and after the negative (capacitive) “blip,” which is the shunt capacitor. The gated cursor math function displays the capacitance as 3.12pF, which is well within the 10% tolerance of the capacitor.
5 Tips for Better Measurement
- A single measurement trace is used, which is the TDR trace connected to CH2. Maximize the signal to noise ratio of this channel by making the waveform fill the window as much as possible and include trace averaging.
- The setup file includes the pulse voltage, reflection coefficient, the impedance and the capacitor and inductor calculations. Disabling unused traces will provide better viewing of the desired waveform. Be sure to turn off the display; do not delete the math functions. Maximize the SNR BEFORE turning off the channel display.
- The capacitors were soldered at the middle for the demo board, allowing clean lead-in and lead-out traces to minimize reflections near the measurement.
- Smaller pitch probes provide higher bandwidth, which allows a sharper measurement.
- ALWAYS measure a known value, and of similar magnitude, before measuring an unknown value.
Conclusion
The TDR provided accurate measurements of a 500fF capacitor and a 280pH inductor. In both cases the signal to noise ratio was good and the traces were clear. This suggests that it is possible to measure even smaller values of inductance and capacitance.
References
[1] You can download a setup file for the Picotest J2151A PerfectPulse® Fast Edge Signal Generator and Tektronix MSO 5/6 oscilloscope.
[2] Video demo:
Further Reading
Power Integrity: Measuring, Optimizing, and Troubleshooting Power Related Parameters in Electronics Systems, Sandler, McGraw-Hill
https://www.picotest.com/measurements/MeasuringPCB.html
https://www.tek.com/document/fact-sheet/tdr-impedance-measurements-foundation-signal-integrity
https://www.sisoft.com/uploads/TDR_Reading_the_Tea_Leaves_MS.pdf
https://www.hpl.hp.com/hpjournal/96apr/apr96a11.htm