This paper reports on high-speed serial link error propagation models and different Ethernet PMA multiplexing and codeword interleaving used to provide FEC performance analysis for 100/200/400 GbE systems with 100+ Gb/s per lane PAM4 interfaces. Different scenarios such as 1/ (1+D) mod4 precoding, PMA bit multiplexing, symbol multiplexing and FEC codeword interleaving and their impacts on overall system performance are discussed. For a technical background discussion on FEC, see this article, What is FEC, and how do I use it?
Future data center and high speed computation require 100+ Gb/s per lane connectivity to meet the increasing set of applications and bandwidth. The IEEE 802.3bj 100 GbE interface is based on an aggregation of 4 lanes, with each lane’s data rate of 25.7812 Gb/s [1]. To enable higher density and lower cost systems, IEEE 802.3bs [2] and 802.3cd [3] deployed 4 or 8 lanes of 53.125 Gb/s to support 200 GbE and 400 GbE. In order to continuously double the system bandwidth and density, the IEEE 802.3 has recently established the 802.3ck [4] 100 Gb/s, 200 Gb/s, and 400 Gb/s electrical interfaces task force to support single or multiple lanes of 100+ Gb/s.
Since 2013, industry has painfully but successfully incorporated signaling format updates from NRZ to PAM4 during the transition from 25 Gb/s to 50 Gb/s link data rates. The design challenges of PAM4 SerDes, such as linearity and tuning complexity, are not the focus of this paper. However assuming the same maximum signal amplitude, the detection penalty of four-level signaling format (PAM4) over two-level signaling format (NRZ) is 9.54 dB or even larger if considering horizontal margin degradation due to multi-level signal crossings.
It is an indisputable fact that the PAM4 detection penalty can be partially offset by forward error correction (FEC), and FEC becomes a part of the PAM4 system solution [5]. The interfaces of 25 Gb/s or slower data rates normally do not take advantage of FEC and therefore target very low detector error ratio (DER0). Note that DER0 is the baud rate PAM4 symbol error rate for a symbol by symbol detector. It is equivalent to bit error ratio (BER) for NRZ signaling format while DER0 is generally twice of BER for PAM4 signaling format. FEC can relax the DER0 target significantly with the promise that the BER will be acceptably low following error correction. For example, DER0 requirement in IEEE802.3cd is 10-4 to achieve final post-FEC BER performance of 10-13 for 200/400 GbE.
The experience (and lesson learned) from PAM4 SerDes development and system production [6] [7] highlighted that pre-FEC SerDes DER0 performance is no longer a reliable overall system performance metric, and does not correlate well to the post-FEC metric required for an accurate system performance evaluation. Furthermore, it is hard (if not impossible) to simulate system performance bit by bit due to the long simulation time and low post-FEC BER requirement of 10-13 or lower. Therefore, accurate and fast analysis methods become essential for 50 Gb/s and 100 Gb/s serial link system.
This paper begins with error propagation models of random and burst errors. The models can be analytical and Monte Carlo simulation based and the correlation between those two is presented. Different Ethernet coding scenarios such as 1/(1+D) mod4 precoding, Physical Medium Attachment (PMA) multiplexing and codeword interleaving schemes have been studied and simulated to provide FEC performance analysis for 100/200/400 GbE systems with 100+ Gb/s per lane PAM4 interface. Multi-part link systems where a single FEC is shared between electrical and optical parts are then addressed. Finally, advanced FEC schemes beyond current KP4 code will be explored.
Random and burst error models
In this section, different error models will be studied.
Binary symmetrical channel (BSC) random error model
This section reviews how a simple random error model can be used to study FEC coding gain for a binary symmetric channel with additive Gaussian noise. The random PAM4 symbol error rate prior FEC coding is
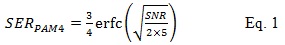
where SNR is signal to noise ratio at the PAM4 symbol detector. Eq. 1 assumes the PAM4 signal variance is 5 with four signaling levels as 3, 1, -1, and -3. Note that SERPAM4 is equivalent to DER0 defined in Ethernet specifications 802.3bs and 802.3cd. For the PAM4 4-level signaling format, noise effects likely cause a detection error between two adjacent levels. For gray coded PAM4, this causes one of the two bits in each PAM4 symbol to be in error. Therefore,
Independent random bit errors are assumed at the input of the FEC decoder of a Reed Solomon (RS) code (n, k, t) over GF (2l), where n is the codeword length and k is the information length [11]. Each RS code symbol has l bits, i.e., m=l/2 2-bit PAM4 symbols. The input RS symbol error rate prior FEC decoder can be calculated as

With t symbol error correction capability in each codeword, the uncorrectable RS codeword error rate after decoding is

The RS symbol error rate after decoding is

Then the bit error rate after RS decoding is approximately
Analytical Gilbert-Elliot channel burst error model
The previous assumption of independent random detector error and Gaussian noise are not always true for channels dominated by inter symbol interference (ISI). Furthermore, error propagation produces burst errors instead of random bit errors when decision feedback equalization (DFE) is included in the receiver. In order to improve the model accuracy, Gilbert-Elliot burst error model [8] [9] can be modified to predict FEC coding gain for an ISI channel and DFE based receiver over PAM4 interfaces.
The error propagation is modeled in this paper on the assumption that the probability of getting an error in the symbol following an initial error is “a”, the probability of a burst of 3 errors is a2, the probability of a burst of 4 is a3, and so on. The Gilbert-Elliot model is limited to 1-tap DFE architectures. If the DFE tap coefficient equals to 1 (the same amplitude as the main signal cursor), a= 0.75 for PAM4. This is derived from 1/4 of the time, error causes the input to saturate to the highest or lowest symbol, the rest of the time (3/4th), there is a 100% chance of an error occurring if DFE tap coefficient is 1. Similarly, if the DFE tap coefficient reduces to 0.5, a=0.375. For the random error case, a=0.
In this section, we only consider the symbol multiplexing and single KP4 FEC coding scheme as described in Figure 1, in which there is no bit-multiplexing and codeword interleaving applied. We will add other coding schemes and their impacts on FEC performance in later sections.
Figure 1 shows how a group of bits encode to RS symbols and later to PAM4 symbols. Each block represents one bit. For each bit, the top number represents corresponding RS symbol index number that it is encoded to and the bottom number represents the corresponding bit index number within that RS symbol. Each 10-bit RS symbol consists of five PAM4 symbols. Each PAM4 symbol consists of two bits, lsb (least significant bit) and msb (most significant bit). In general, one gray coded PAM4 symbol error only consists of either the lsb or msb bit in error, it cannot have two errors simultaneously. If multiple PAM4 symbols (up to five) errors cross the RS symbol boundary, they will cause two RS symbols in error. Otherwise they cause only one RS symbol in error.
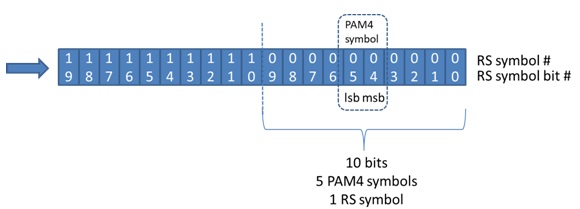
Figure 1. Symbol multiplexing coding scheme without bit-multiplexing and codeword interleaving
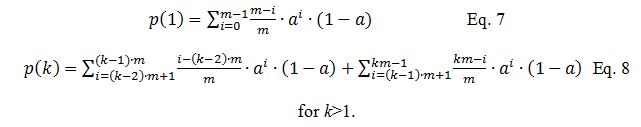
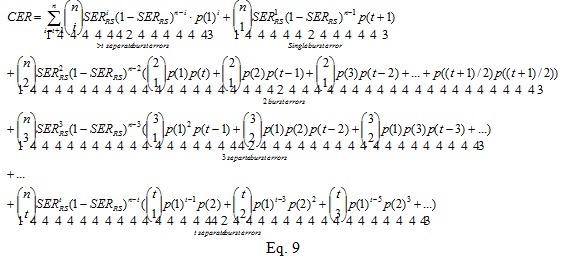
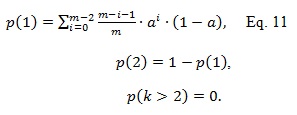
Now we can calculate error signature, {p(1), p(2), p(3), …, p(t)}, the probability of a burst error exactly causing 1, 2, 3, … RS symbol errors given an initial error and its error propagation probability a as
Based on the error signature {p(1), p(2), p(3), …, p(t)} and the initial symbol error rate SERRS, the RS (n, k, t) codeword error rate can be calculated as
For Ethernet applications, the frame loss ratio (FLR) is normally used as the post FEC system performance metric:
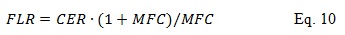
where MFC is the number of MAC frames per codeword, say MFC=8. FLR to post-FEC BER ratio is roughly 620 [10].
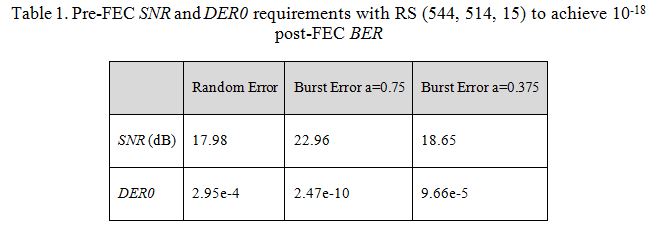
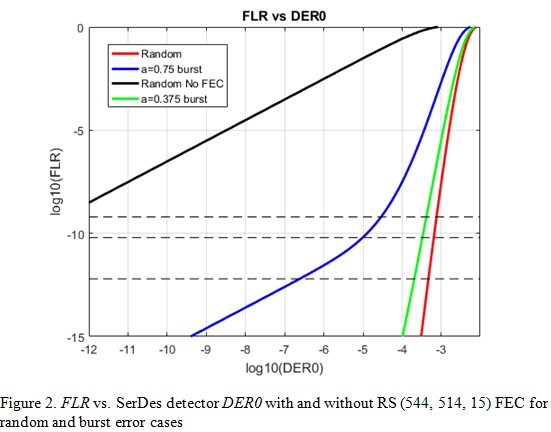
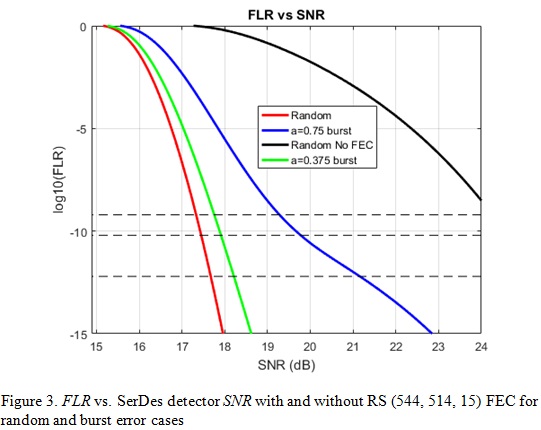
In this section, we focus on the analysis of KP4 FEC, RS (544, 514, 15) over GF (210). Table 1 shows pre-FEC SerDes detector SNR and DER0 requirements to achieve 10-18 post-FEC BER (or 6.2e-16 FLR) for random errors and burst errors with a=0.75 and a=0.375. Figure 2 and 3 show post-FEC FLR performances vs. different pre-FEC DER0 and SNR values with and without KP4 FEC for random error and burst errors. The three dashed line thresholds are equivalent to 10-12 (100 GbE), 10-13 (200/400 GbE) and 10-15 (OIF CEI) post-FEC BERs. We can see that KP4 FEC can significantly relax the SerDes DER0 requirement and provide SNR gains. Burst errors with a=0.75 have less coding gain, or increase pre-FEC DER0 requirement compared with the cases of random error a=0 and burst errors with a=0.375.
1/(1+D) mod 4 precoding
The burst error run length caused by DFE error propagation can be reduced by using precoding. PAM4 precoding 1/(1+D) mod 4 as defined in IEEE 802.3cd 120.5.7.2 [3] is illustrated in Figure 4.
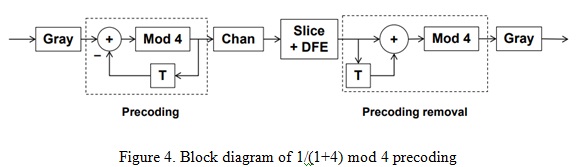
The feature of this precoding is to reduce the long consecutive burst errors {1, -1, 1, -1, 1, -1 …} caused by a 1-tap DFE with a=0.75 into 2 errors per error event, one error at the entry and the other error at the exit. We can calculate the error signature {p(1), p(2), p(3), …, p(t)} with precoding for 1-tap DFE burst error with a=0.75 as
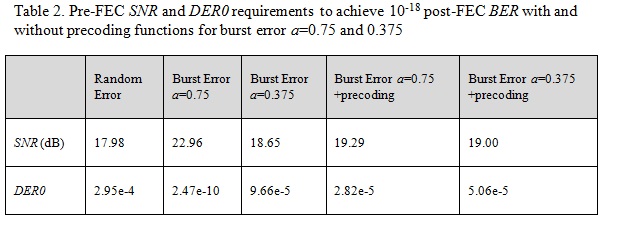
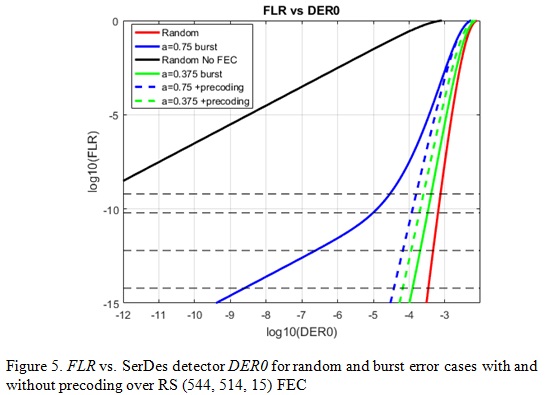
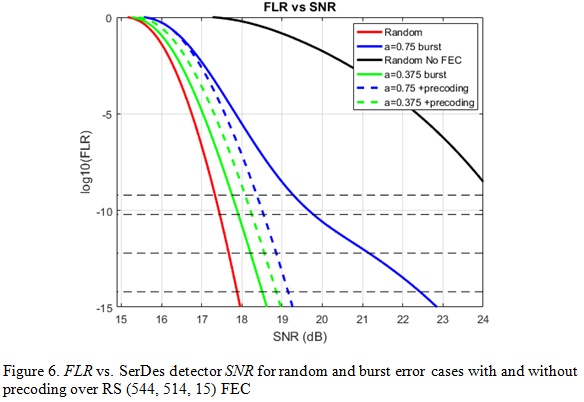
On the other hand, a single random error at the slicer output turns into two errors after the pre-coding is removed. Similarly for a 1-tap DFE with smaller error propagation factor of a=0.375 whose error pattern is unlikely consecutive as {1, -1, 1, -1, 1, -1 …}, hence the fact of reducing the long burst error to 2 errors is not true anymore. Therefore, precoding doesn’t always mitigate error propagation. The analysis results in Table 2 and Figure 5-6 support this statement. For a burst error model with a=0.75 precoding can provide 3.67dB SNR gain and relax DER0 target 5 order of magnitude, while for a burst error model with a=0.375 precoding has 0.35dB SNR and ½ order magnitude DER0 penalty instead.
Since precoding is simple and easy to implement, IEEE 802.3cd has adopted it as a mandatory function to implement in the transmitter but the link can configure to either enable or disable the usage of the precoder depending on the receiver architecture and the error propagation characteristics.
Multiple-tap DFE burst error model
The previous analytical Gilbert-Elliot channel burst-error model is based on a 1-tap DFE receiver architecture. In this section, the analysis is extended to multiple tap DFE architectures. A Monte Carlo simulation approach is applied to model multiple tap DFE error propagation characteristics.
First, random data is generated and encoded using a real set of multiple-tap DFE tap weights obtained from a link simulation or bench measurement. The DFE tap weights are assumed to be exactly equal to the post-cursor samples of the pulse response. A simple pulse response is then generated based on the DFE tap magnitudes. The generated pulse response length matches the length of the DFE buffer. It is convolved with the data to generate the channel response at the DFE input. Gaussian noise is added at the detector slicer such that the received symbols have the simulated or measured DER0 (say 1e-4).
Second, a single error is injected into the detector slicer and error propagation is monitored through the multiple-tap DFE feedback and random noise at the detector slicer. This process is repeated for a programmed number of burst error events (say 1e7 in this paper). Each burst error event simulation uses an independent generation of random data.
Third, error signatures with different FEC coding schemes can be calculated among the simulated number of burst error events. Burst length is defined as the total length of a burst error from the injected error until the last error. Additionally, the error signatures {p(1), p(2), p(3), …, p(t)} of different coding schemes are calculated to understand how they affect FEC performance. Pre-coding functions can be applied in the Monte Carlo simulator to capture its effect. Ethernet bit-multiplexing and codeword interleaving schemes described in the later sections can be simulated as well. Each burst error event occurs randomly and it could locate anywhere in the RS symbols or codewords. To capture different alignments the burst error event is swept through all the possible locations in the RS codewords.
The analysis concludes with the error signature of each case being fed into KP4 FEC model to see its post-FEC FLR and BER performance.
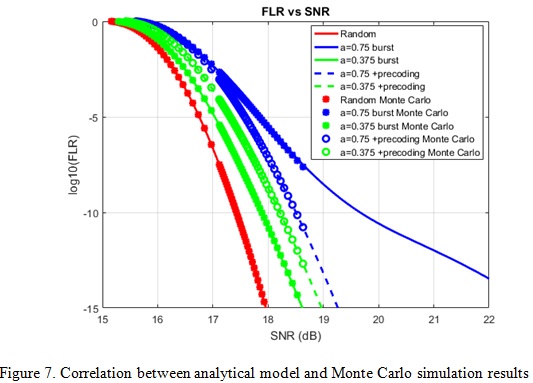
To correlate the previous analytical model with the Monte Carlo simulation, we can compare the results, the error signatures {p(1), p(2), p(3), …, p(t)}, generated by those two. For the random error case, we simply set the DFE tap weights to all zero, h=[0 0 0 0 0 …]. For a 1-tap DFE burst error case we can set DFE tap weights as h=[1 0 0 0 0 …] and h=[0.5 0 0 0 0 …] for a=0.75 and a=0.375, respectively. Figure 7 shows good match between the Monte Carlo simulation (dots and circles) and the analytical random error and the 1-tap DFE Gilbert-Elliot burst error model (solid and dash lines) with and without precoding.
Now we can use the matched Monte Carlo model to simulate the multiple-tap DFE. Four test cases are selected, all with 12 DFE taps. The chosen 12-tap DFE tap weights h are:
- Case 1: h=[0.7 0.2 0.2 0.2 0.2 0.2 0.2 0.2 0.2 0.2 0.2 0.2]
- Case 2: h=[0.7 -0.2 0.2 -0.2 0.2 -0.2 0.2 -0.2 0.2 -0.2 0.2 -0.2]
- Case 3: h=[0.700 0.072 -0.027 -0.039 -0.023 -0.017 -0.012 -0.009 -0.006 -0.006 -0.005 -0.005]
- Case 4: h=[0.700 0.200 0.200 0.200 0.200 0.147 0.116 0.086 0.071 0.056 0.044 0.042]
Case 1 and 2 apply the maximum tap weights as defined in IEEE 802.3cd [3], b_max (1)=0.7 and b_max (2:12)=0.2. Case 1 has the same polarity for DFE taps h2-h12 while case 2 has an opposite polarity. Case 1 and 2 represent the worst cases to make some bounds on performance. Cases 3 and 4 are real DFE tap coefficients obtained from COM calculations over a real channel at 112 Gb/s data rate. Case 3 has reflections and Case 4 has a long decaying ISI tail.
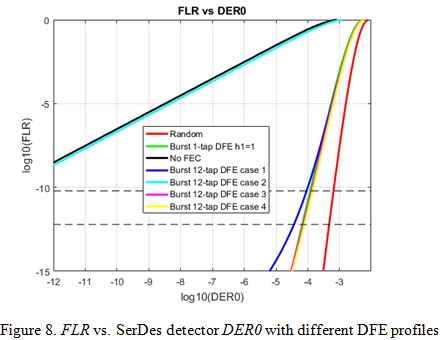
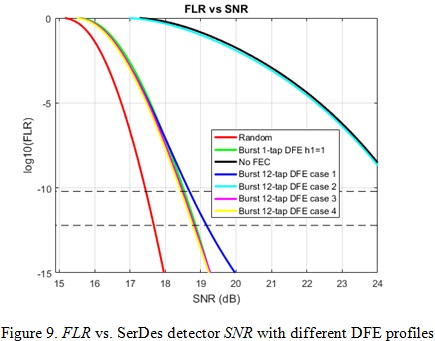
Precoding is enabled for all cases. From the simulation results shown in Figure 8 and 9 we can see that results of cases 3 and 4 are close to the result of 1-tap DFE a=0.75. In other words, the analytical Gilbert-Elliot channel burst error model is a good candidate for FEC performance analysis in 100/200/400 GbE systems with 100+ Gb/s per lane PAM4 interfaces.
Case 1 has a little worse performance than a 1-tap DFE case, but not too much. However, Case 2 with the opposite polarity DFE coefficients has significant error propagation beyond the KP4 error correction capability. Case 2 is too pessimistic to predict FEC performance analysis for 100/200/400 GbE systems since the chance of all DFE taps toggling with opposite polarity and reaching maximum coefficient constraints is very low.