S-parameters have a rich mathematical formalism in which there is no ambiguity. But when it comes to translating the mathematics of S-parameters into the practical interpretation of an interconnect’s electrical properties, confusion can slip in by way of an inexperienced user spreading misconceptions to a new user not sure what is important and what is not. In this article I reveal seven features of S-parameters that are confusing and how not to be confused.
Confusion #1
Fundamentally, an S-parameter, short for “scattering” parameter, is a measure of the ratio of the scattered voltage wave to the incident voltage wave to a device under test (DUT). The formalism was originally established in the frequency domain, where the voltage waves are sine waves.
The ratio of what comes out compared to what goes in, is basically a transfer function. It describes the response of the system to sine waves. A sine wave has only three figures of merit:
- A frequency
- An amplitude
- A phase
When we measure the response of an interconnect to sine waves, we are assuming the interconnect satisfies three important properties:
- Passive- no gain, just loss
- Linear- one frequency goes in, the same frequency comes out, no new frequencies are created
- Time invariant- it is static, the geometry and other features are not changing during the measurement
This means that when we send in a sine wave of 1 GHz, we get a sine wave of 1 GHz and only 1 GHz coming out. The only qualities that can change are the amplitude and phase. The description of a sine wave in the frequency domain is as a complex number, with either a real and imaginary component or an amplitude and phase. Their complex nature and the complex math used to describe them are sometimes a source of confusion.
Confusion #2
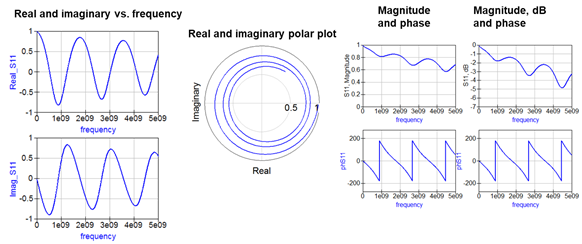
When we take the ratio of two sine waves of the same frequency, we get a complex number. The magnitude is the ratio of the amplitudes of the coming out wave compared to the going in wave, and the phase of the S-parameter is the difference in phase between the coming out wave compared to the going in wave.
We can plot the value of the complex number across the frequency range in one of three ways: as real and imaginary, in polar plot, and as magnitude and phase. These three examples are shown in Figure 1. Each of these plots is the same data, just displayed differently. This is sometimes a source of confusion.
Confusion #3
Ports are the connections to the DUT into which, and from which, we measure the sine wave signals. The way to think about a port is that it is like a coax connector with a specific characteristic impedance and a connection to BOTH the signal and return path of the DUT, like shown in Figure 2.
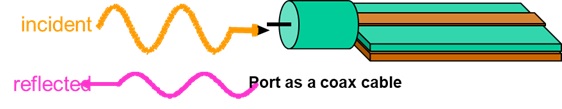
If you don't engineer the connection to the return path, the signal will find a path and you may not like the path it finds.
Confusion #4
The port is part of the system that is measuring or simulating the S-parameters. Both the incident signal and a possible reflected signal will simultaneously propagate in the same port and will not interact with each other. The system that extracts the S-parameters will separate out the incident and reflected propagating signals.
The impedance of the port is as important influencing the S-parameters as the DUT. This is why it is important to know what it is. Unless there is a strong compelling reason, always use 50 Ohms. If another port impedance is used, it will be captured in the Touchstone file, but the shape and patterns will look different.
Confusion #5
When we have multiple ports to the DUT, we identify them with unique consecutive index numbers starting at 1. In principle, the index numbers of the ports connected to the DUT don’t matter as long as we are consistent in how we use them. In practice, I find this one issue to be the major source of misinterpreting S-parameters.
Confusion #6
The port index numbers are important because this is how we label each S-parameter term. With four ports on the DUT, for example, there are 16 combinations of a going in and a coming out. Data management is a surprisingly important aspect of using the S-parameters of a channel.
We use the index number assigned to the ports as a way of uniquely identifying each S-parameter term. Since each S-parameter element is a ratio of a sine wave coming out compared to the sine wave going in, we use the index numbers of the coming out and going in ports to label the S-parameter elements.
Wouldn’t it make sense to call the S-parameter corresponding to the sine wave going in on port 1 and coming out of port 2, S 1à2 or S12? Because of the matrix math behind the origin of the S-parameters, this is not the way we label each element. The coming out port is the first index and the going in port is the second index. This S-parameter would be identified as S21. The first index number is the coming out port, the second index number in the going in port.
Confusion #7
If you hear someone referring to S21 as “S twenty one,” assume this person does not have a clue about S-parameters and be wary of accepting what they tell you.
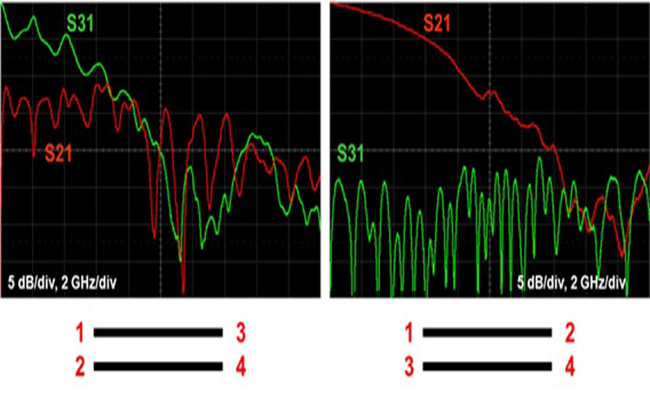
If the DUT has one port or two ports, there is only one way of assigning the ports. But, if there are four ports, there are multiple possible assignments. Figure 3 shows two possible labeling options for a 4-port DUT.

Which port assignment used makes a difference. If Method A is used, an insertion loss is an S21. If Method B is used, an insertion loss is S31. If your S-parameter model is used in a circuit simulation and you do not look at the files, you will get simulated results, but they will be wrong. If you even notice the simulation looks off, you may waste hours of head scratching trying to rationalize the results.
The way to tell which port assignment your S-parameter model uses is to look at a column of S-parameters. Figure 4 shows examples of the worst performing interconnects I could find, with different port assignments. If S21 looks like an insertion loss, starting at 0 dB at low frequency and monotonically dropping off, then the port assignment is Method A (right). If it’s S31, it’s Method B (left). Either way, the insertion loss is easy to distinguish.

A few minutes upfront checking will save you hours of frustration later.
Conclusion
These are just some of the confusing aspects of S-parameters that have nothing to do with how we interpret them, just about how we use them. Now that you are aware of these potential potholes, you can avoid them when you look at your S-parameters.
Also See:
S-parameters: Signal Integrity Analysis in the Blink of an Eye, Alfred P. Neves, Mike Resso, and Chun-Ting Wang Lee, Signal Integrity Journal March 2017. https://www.signalintegrityjournal.com/articles/432-s-parameters-signal-integrity-analysis-in-the-blink-of-an-eye
S-parameter Renormalization, The Art of Cheating, Gustavo J. Blando. Signal Integrity Journal January 12, 2017. https://www.signalintegrityjournal.com/articles/270-s-parameter-renormalization-the-art-of-cheating